

Protein expression analysis of chronic lymphocytic leukemia defines the effect of genetic aberrations and uncovers a correlation of CDK4, P27 and P53 with hierarchical risk
- PMID: 20713460
- PMCID: PMC2966910
- DOI: 10.3324/haematol.2010.025734
Protein expression analysis of chronic lymphocytic leukemia defines the effect of genetic aberrations and uncovers a correlation of CDK4, P27 and P53 with hierarchical risk
Abstract
Background: Chronic lymphocytic leukemia has a variable clinical course. Genomic aberrations identify prognostic subgroups, pointing towards distinct underlying biological mechanisms that are poorly understood. In particular it remains unclear whether the prognostic subgroups of chronic lymphocytic leukemia are characterized by different levels of leukemogenic proteins.
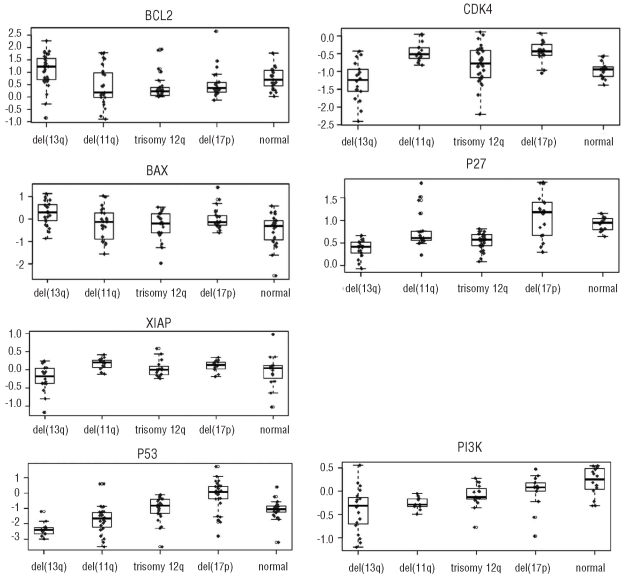
Design and methods: Expression of 23 proteins involved in apoptosis, proliferation, DNA damage, and signaling or whose genes map to chromosomal regions known to be critical in chronic lymphocytic leukemia was quantified in 185 cytogenetically well characterized cases of chronic lymphocytic leukemia using immunoblotting. Cases were categorized hierarchically into deletion(17p), deletion(11q), trisomy 12, deletion(13q) as sole abnormality or normal karyotype. Statistical analysis was performed for expression differences between these subgroups. In addition, the expression levels of CDK4, P27 and P53 were quantified over the clinical course and compared to levels in immunopurified B cells from healthy individuals.
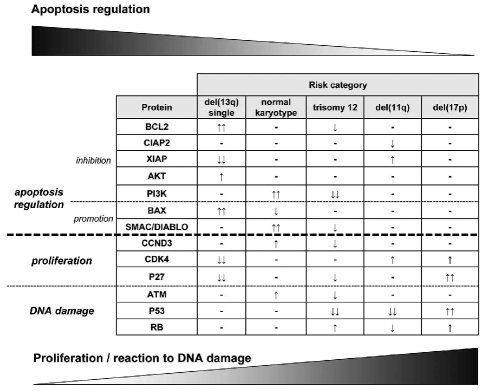
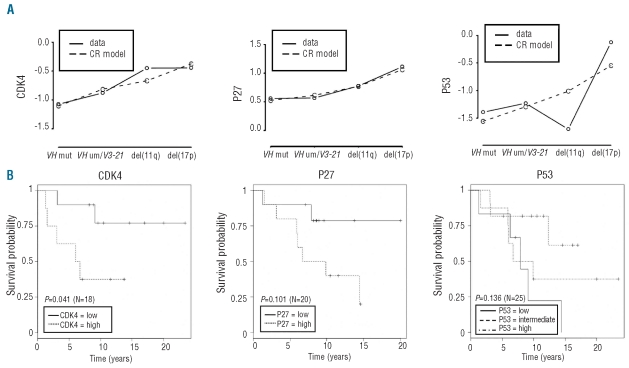
Results: In subgroups with a good prognosis, differential expression was mainly seen for proteins that regulate apoptosis. In contrast, in cytogenetic subgroups with a worse prognosis, differential expression was mostly detected for proteins that control DNA damage and proliferation. Expression levels of CDK4, P27 and P53 were higher compared to those in B cells from healthy individuals and significantly correlated with increasing hierarchical risk. In addition, no significant longitudinal changes of expression levels of CDK4, P27 and P53 could be detected in chronic lymphocytic leukemia patients.
Conclusions: Differences in expression levels of apoptosis- and proliferation-controlling proteins define distinct prognostic subgroups of chronic lymphocytic leukemia and uncover a correlation of levels of CDK4, P27 and P53 proteins with higher hierarchical risk.
Figures
References
-
- Dohner H, Stilgenbauer S, Benner A, Leupolt E, Krober A, Bullinger L, et al. Genomic aberrations and survival in chronic lymphocytic leukemia. N Engl J Med. 2000;343(26):1910–6. - PubMed
-
- Chiorazzi N, Rai KR, Ferrarini M. Chronic lymphocytic leukemia. N Engl J Med. 2005;352(8):804–15. - PubMed
-
- Krober A, Seiler T, Benner A, Bullinger L, Bruckle E, Lichter P, et al. V(H) mutation status, CD38 expression level, genomic aberrations, and survival in chronic lymphocytic leukemia. Blood. 2002;100(4):1410–6. - PubMed
-
- Thorselius M, Krober A, Murray F, Thunberg U, Tobin G, Buhler A, et al. Strikingly homologous immunoglobulin gene rearrangements and poor outcome in VH3-21-using chronic lymphocytic leukemia patients independent of geographic origin and mutational status. Blood. 2006;107(7):2889–94. - PubMed
-
- Zenz T, Mertens D, Kuppers R, Dohner H, Stilgenbauer S. From pathogenesis to treatment of chronic lymphocytic leukaemia. Nat Rev Cancer. 2010;10(1):37–50. - PubMed
Publication types
MeSH terms
Substances
LinkOut - more resources
Full Text Sources
Research Materials
Miscellaneous
