

Tumor heterogeneity is an active process maintained by a mutant EGFR-induced cytokine circuit in glioblastoma
- PMID: 20713517
- PMCID: PMC2922502
- DOI: 10.1101/gad.1890510
Tumor heterogeneity is an active process maintained by a mutant EGFR-induced cytokine circuit in glioblastoma
Abstract
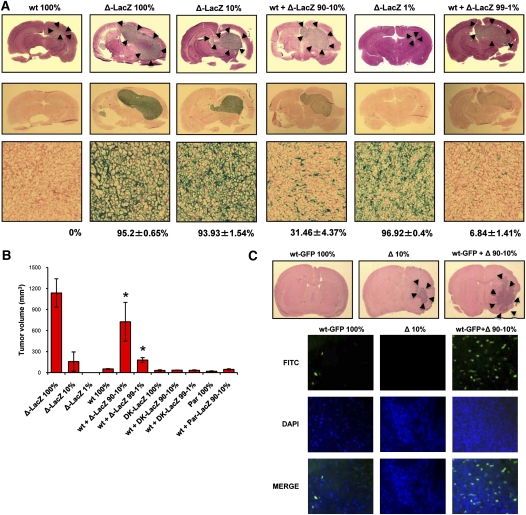
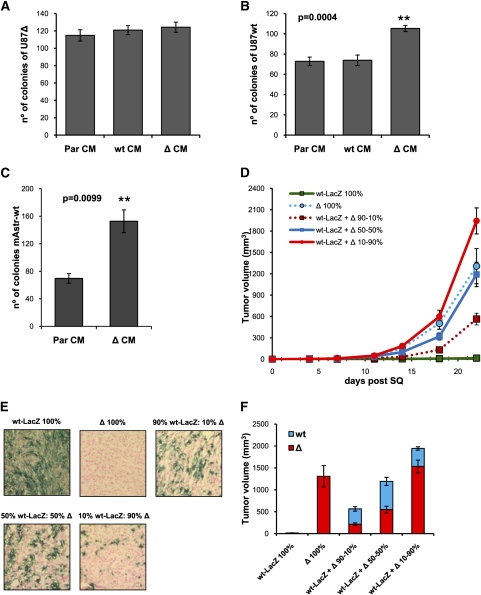
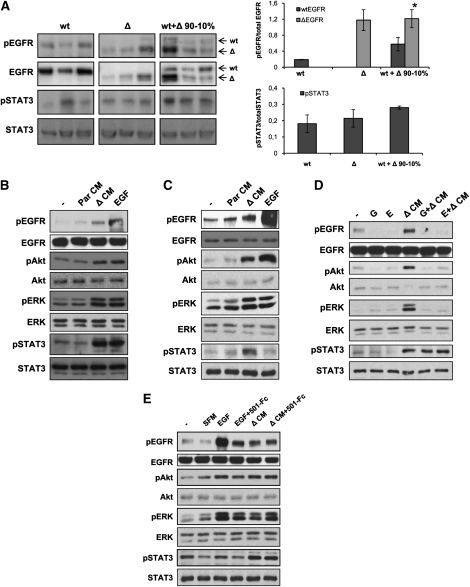
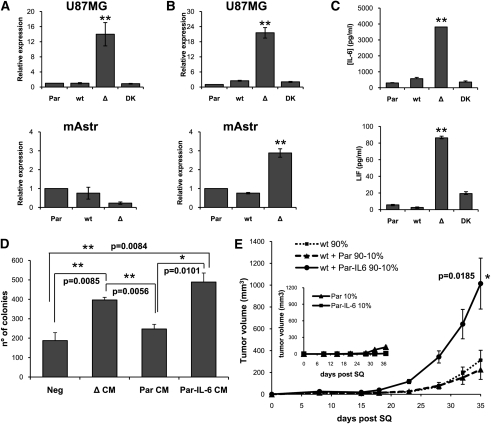
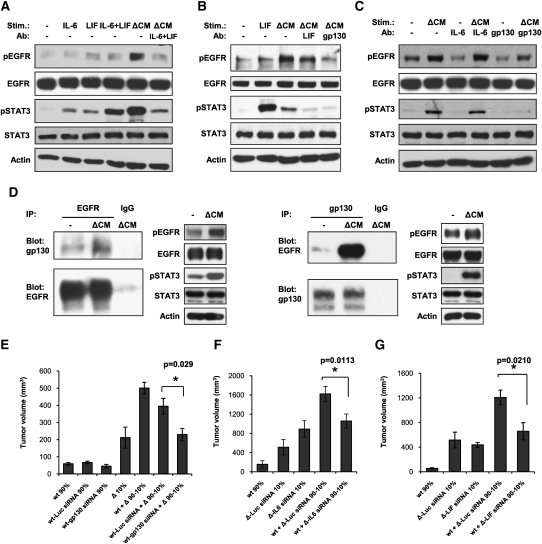
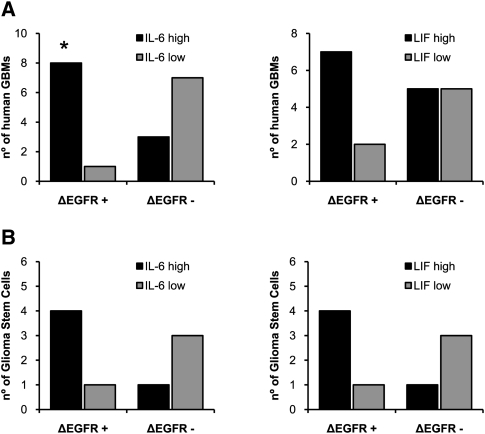
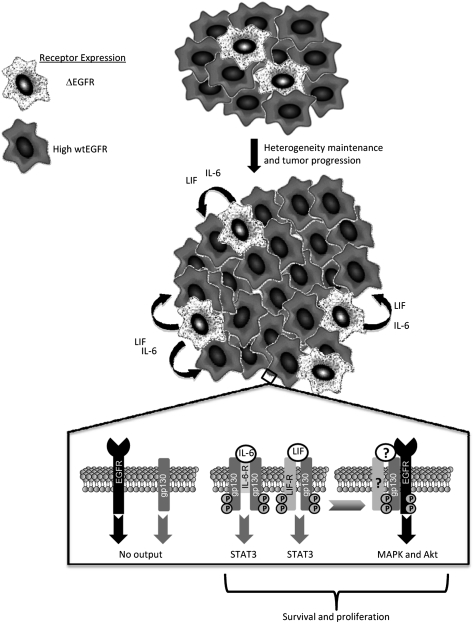
Human solid tumors frequently have pronounced heterogeneity of both neoplastic and normal cells on the histological, genetic, and gene expression levels. While current efforts are focused on understanding heterotypic interactions between tumor cells and surrounding normal cells, much less is known about the interactions between and among heterogeneous tumor cells within a neoplasm. In glioblastoma multiforme (GBM), epidermal growth factor receptor gene (EGFR) amplification and mutation (EGFRvIII/DeltaEGFR) are signature pathogenetic events that are invariably expressed in a heterogeneous manner. Strikingly, despite its greater biological activity than wild-type EGFR (wtEGFR), individual GBM tumors expressing both amplified receptors typically express wtEGFR in far greater abundance than the DeltaEGFR lesion. We hypothesized that the minor DeltaEGFR-expressing subpopulation enhances tumorigenicity of the entire tumor cell population, and thereby maintains heterogeneity of expression of the two receptor forms in different cells. Using mixtures of glioma cells as well as immortalized murine astrocytes, we demonstrate that a paracrine mechanism driven by DeltaEGFR is the primary means for recruiting wtEGFR-expressing cells into accelerated proliferation in vivo. We determined that human glioma tissues, glioma cell lines, glioma stem cells, and immortalized mouse Ink4a/Arf(-/-) astrocytes that express DeltaEGFR each also express IL-6 and/or leukemia inhibitory factor (LIF) cytokines. These cytokines activate gp130, which in turn activates wtEGFR in neighboring cells, leading to enhanced rates of tumor growth. Ablating IL-6, LIF, or gp130 uncouples this cellular cross-talk, and potently attenuates tumor growth enhancement. These findings support the view that a minor tumor cell population can potently drive accelerated growth of the entire tumor mass, and thereby actively maintain tumor cell heterogeneity within a tumor mass. Such interactions between genetically dissimilar cancer cells could provide novel points of therapeutic intervention.
Figures
Similar articles
-
Molecular characterization of EGFR and EGFRvIII signaling networks in human glioblastoma tumor xenografts.Mol Cell Proteomics. 2012 Dec;11(12):1724-40. doi: 10.1074/mcp.M112.019984. Epub 2012 Sep 10. Mol Cell Proteomics. 2012. PMID: 22964225 Free PMC article.
-
EGFRvIII promotes glioma angiogenesis and growth through the NF-κB, interleukin-8 pathway.Oncogene. 2012 Sep 6;31(36):4054-66. doi: 10.1038/onc.2011.563. Epub 2011 Dec 5. Oncogene. 2012. PMID: 22139077 Free PMC article.
-
Mutant EGFR is required for maintenance of glioma growth in vivo, and its ablation leads to escape from receptor dependence.Proc Natl Acad Sci U S A. 2010 Feb 9;107(6):2616-21. doi: 10.1073/pnas.0914356107. Epub 2010 Jan 21. Proc Natl Acad Sci U S A. 2010. PMID: 20133782 Free PMC article.
-
Aberrant receptor signaling in human malignant gliomas: mechanisms and therapeutic implications.Cancer Lett. 2001 Jan;162 Suppl:S17-S21. doi: 10.1016/s0304-3835(00)00648-0. Cancer Lett. 2001. PMID: 11164186 Review.
-
EGFR-dependent mechanisms in glioblastoma: towards a better therapeutic strategy.Cell Mol Life Sci. 2014 Sep;71(18):3465-88. doi: 10.1007/s00018-014-1608-1. Epub 2014 Mar 27. Cell Mol Life Sci. 2014. PMID: 24671641 Free PMC article. Review.
Cited by
-
STAT3-PTTG11 abrogation inhibits proliferation and induces apoptosis in malignant glioma cells.Oncol Lett. 2020 Oct;20(4):6. doi: 10.3892/ol.2020.11867. Epub 2020 Jul 15. Oncol Lett. 2020. PMID: 32774480 Free PMC article.
-
EGFRvIII: the promiscuous mutation.Cell Death Discov. 2016 Jul 4;2:16049. doi: 10.1038/cddiscovery.2016.49. eCollection 2016. Cell Death Discov. 2016. PMID: 27551537 Free PMC article. No abstract available.
-
Adverse prognostic impact of intratumor heterogeneous HER2 gene amplification in patients with esophageal adenocarcinoma.J Clin Oncol. 2012 Nov 10;30(32):3932-8. doi: 10.1200/JCO.2012.43.1890. Epub 2012 Sep 17. J Clin Oncol. 2012. PMID: 22987085 Free PMC article.
-
miR-219-5p inhibits receptor tyrosine kinase pathway by targeting EGFR in glioblastoma.PLoS One. 2013 May 17;8(5):e63164. doi: 10.1371/journal.pone.0063164. Print 2013. PLoS One. 2013. PMID: 23690991 Free PMC article.
-
Detection, Characterization, and Inhibition of FGFR-TACC Fusions in IDH Wild-type Glioma.Clin Cancer Res. 2015 Jul 15;21(14):3307-17. doi: 10.1158/1078-0432.CCR-14-2199. Epub 2015 Jan 21. Clin Cancer Res. 2015. PMID: 25609060 Free PMC article. Clinical Trial.
References
-
- Adams TE, Koziolek EJ, Hoyne PH, Bentley JD, Lu L, Lovrecz G, Ward CW, Lee FT, Scott AM, Nash AD, et al. 2009. A truncated soluble epidermal growth factor receptor-Fc fusion ligand trap displays anti-tumour activity in vivo. Growth Factors 27: 141–154 - PubMed
-
- Allinen M, Beroukhim R, Cai L, Brennan C, Lahti-Domenici J, Huang H, Porter D, Hu M, Chin L, Richardson A, et al. 2004. Molecular characterization of the tumor microenvironment in breast cancer. Cancer Cell 6: 17–32 - PubMed
-
- Al-Nedawi K, Meehan B, Micallef J, Lhotak V, May L, Guha A, Rak J 2008. Intercellular transfer of the oncogenic receptor EGFRvIII by microvesicles derived from tumour cells. Nat Cell Biol 10: 619–624 - PubMed
-
- Bachoo RM, Maher EA, Ligon KL, Sharpless NE, Chan SS, You MJ, Tang Y, DeFrances J, Stover E, Weissleder R, et al. 2002. Epidermal growth factor receptor and Ink4a/Arf: Convergent mechanisms governing terminal differentiation and transformation along the neural stem cell to astrocyte axis. Cancer Cell 1: 269–277 - PubMed
Publication types
MeSH terms
Substances
Grants and funding
LinkOut - more resources
Full Text Sources
Other Literature Sources
Research Materials
Miscellaneous