. 2010 Aug 15;24(16):1746-57.
doi: 10.1101/gad.1929210.

Foxp1 coordinates cardiomyocyte proliferation through both cell-autonomous and nonautonomous mechanisms

Affiliations

Foxp1 coordinates cardiomyocyte proliferation through both cell-autonomous and nonautonomous mechanisms

Yuzhen Zhang et al. Genes Dev. .

Abstract

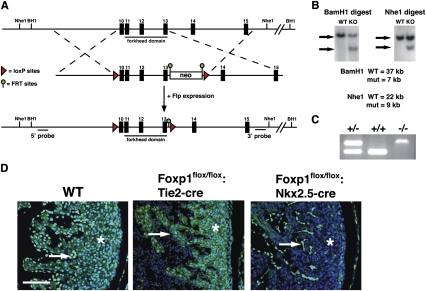
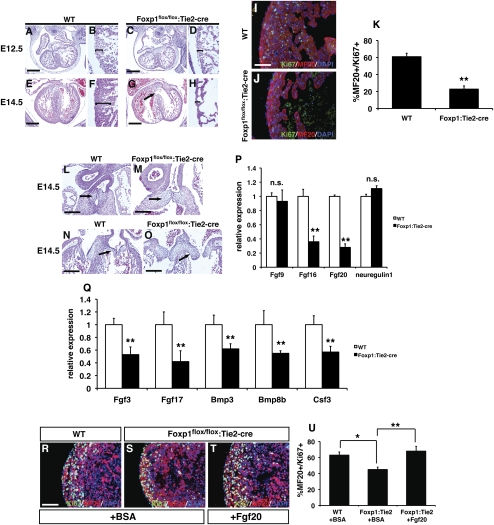
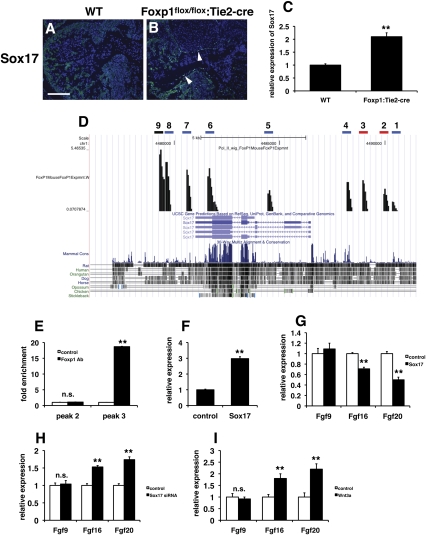
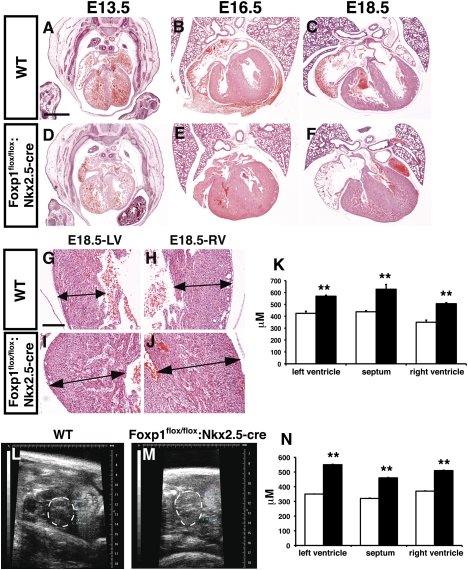
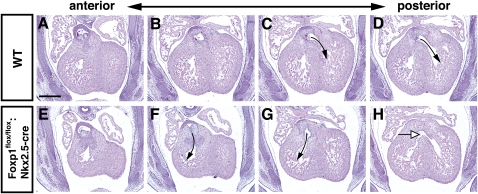
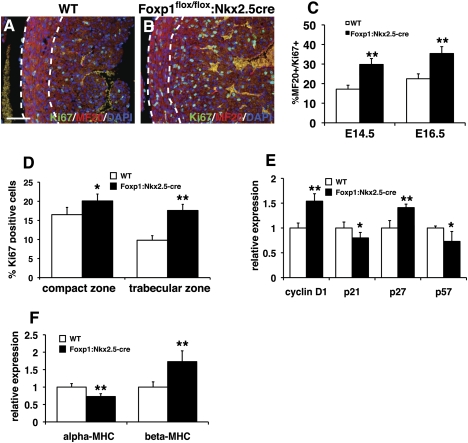
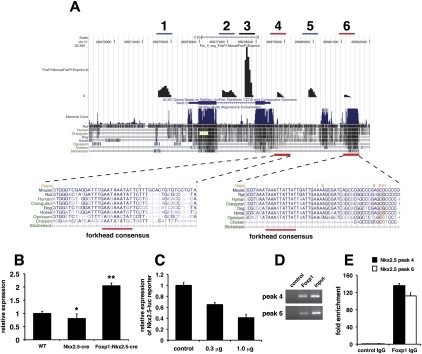
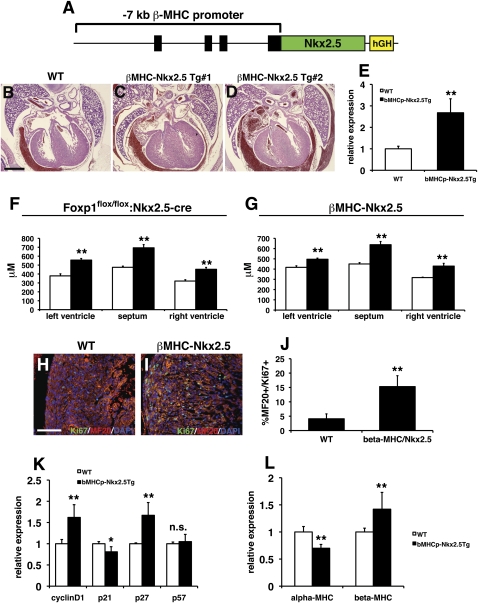
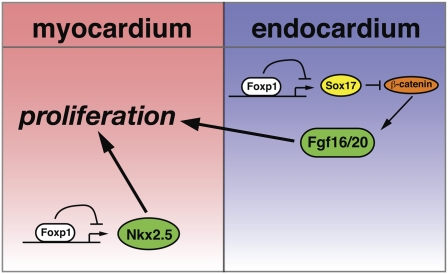
Cardiomyocyte proliferation is high in early development and decreases progressively with gestation, resulting in the lack of a robust cardiomyocyte proliferative response in the adult heart after injury. Little is understood about how both cell-autonomous and nonautonomous signals are integrated to regulate the balance of cardiomyocyte proliferation during development. In this study, we show that a single transcription factor, Foxp1, can control the balance of cardiomyocyte proliferation during development by targeting different pathways in the endocardium and myocardium. Endocardial loss of Foxp1 results in decreased Fgf3/Fgf16/Fgf17/Fgf20 expression in the heart, leading to reduced cardiomyocyte proliferation. This loss of myocardial proliferation can be rescued by exogenous Fgf20, and is mediated, in part, by Foxp1 repression of Sox17. In contrast, myocardial-specific loss of Foxp1 results in increased cardiomyocyte proliferation and decreased differentiation, leading to increased myocardial mass and neonatal demise. We show that Nkx2.5 is a direct target of Foxp1 repression, and Nkx2.5 expression is increased in Foxp1-deficient myocardium. Moreover, transgenic overexpression of Nkx2.5 leads to increased cardiomyocyte proliferation and increased ventricular mass, similar to the myocardial-specific loss of Foxp1. These data show that Foxp1 coordinates the balance of cardiomyocyte proliferation and differentiation through cell lineage-specific regulation of Fgf ligand and Nkx2.5 expression.


Figures

Figure 1.
Figure 1.
Conditional targeting strategy for Foxp1. (A) Targeting strategy for generating the conditional Foxp1 mouse allele. Exons 10–13 were flanked with loxP sites deleting the entire forkhead DNA-binding domain. Flpe mice were used to delete the FRT-flanked neomycin cassette. (B) Southern blot results from targeted ES clones using the 5′ and 3′ probes indicated in A. (C) PCR genotyping results from germline mice of the indicated genotypes using primers listed in Supplemental Table 1. (D) Immunostaining with Foxp1 antibody on wild type and Foxp1flox/flox:Nkx2.5-cre mutants at E14.5, as well as Foxp1flox/flox:Tie2-cre mutants at E14.5. Asterisk indicates myocardium where expression is missing in Foxp1flox/flox:Nkx2.5-cre mutants, and arrows indicate endocardium where expression is absent in Foxp1flox/flox:Tie2-cre mutants. Bar, 50 μm.
Figure 2.
Figure 2.
Foxp1flox/flox:Tie2-cre mutants exhibit endocardial cushion defects and reduced ventricular myocardial development and proliferation, which are due to loss of Fgf16 and Fgf20 expression. H + E staining of wild type (A,B) and Foxp1flox/flox:Tie2-cre mutants (C,D) at E12.5 showing a slight thinning of ventricular myocardium in the mutants. (E–H) By E14.5, Foxp1flox/flox:Tie2-cre mutants exhibit extensive ventricular thinning and pronounced VSDs as compared with wild-type littermates. (I–K) This reduced ventricular myocardial development correlates with a loss in myocardial proliferation, as shown by reduced Ki67/MF20 coimmunostaining at E12.5. Both OFT (L,M) and AV canal (N,O) endocardial cushions are enlarged in Foxp1flox/flox:Tie2-cre mutants, suggesting defective endocardial–mesenchymal transformation. (P) Expression of Fgf16 and Fgf20, but not Fgf9 and neuregulin, are reduced in Foxp1flox/flox:Tie2-cre mutants. (Q) Q-PCR results from growth factor PCR array studies showing decreased Fgf3, Fgf17, Bmp3, Bmp8b, and Csf3 expression in Foxp1flox/flox:Tie2-cre mutants at E12.5. Myocardial proliferation defects in Foxp1flox/flox:Tie2-cre mutants can be rescued with exogenous Fgf20 (T,U) but not BSA (R,S,U). Proliferation assessments were made on three embryos of each indicated genotype/condition, and the data represent the average ± SEM. Q-PCR data represent the average of three different assays performed in triplicate ± SEM. All data are considered significant using Student's t-test unless otherwise noted. (n.s.) Not significant; (*) P < 0.05; (**) P < 0.01. Bars: I,J, 30 μm; R–T, 50 μm.
Figure 3.
Figure 3.
Sox17 is a direct target of Foxp1 in the endocardium, and overexpression of Sox17 represses Fgf16/20 expression. (A,B) Immunostaining shows that Sox17 expression is increased in the endocardium of Foxp1flox/flox:Tie2-cre mutants at E12.5 (arrowheads). (C) Q-PCR shows increased Sox17 expression in Foxp1flox/flox:Tie2-cre mutants at E12.5. (D) ChIP-seq data showing peaks with forkhead DNA-binding sites (red bar), peaks unique to Foxp1 antibody ChIP-seq analysis but lacking forkhead DNA-binding sites (blue bars), and peaks that were also observed in control IgG ChIP-seq analysis (black bar). (E) ChIP analysis shows that Foxp1 binds to the peak 3 region but not the peak 2 region efficiently. (F) Lentiviral overexpression results in a threefold increase of Sox17 expression in HUVECs, as measured by Q-PCR. (G) Overexpression of Sox17 in HUVECs results in decreased expression of Fgf16 and Fgf20 but not Fgf9, as measured by Q-PCR. (H) siRNA inhibition of Sox17 expression leads to increased Fgf16 and Fgf20 expression. (I) Wnt3a treatment of HUVECs results in increased Fgf16 and Fgf20 expression. All data are considered significant using Student's t-test unless otherwise noted. (n.s.) Not significant; (**) P < 0.01. Bar: A,B, 100 μm.
Figure 4.
Figure 4.
Foxp1flox/flox:Nkx2.5-cre mutants exhibit increased ventricular wall thickness. H + E staining of wild type (A–C) and Foxp1flox/flox:Nkx2.5-cre mutants (D–F) from E13.5–E18.5 showing increased ventricular wall thickness at E16.5 and E18.5. (G–K) This increased thickness is observed in the wall of the left and right ventricles, as well as the ventricular septum. (L–N) Increased ventricular wall thickness is also observed in vivo using echocardiography. All data are considered significant using Student's t-test. (**) P < 0.01. Measurements are the average of three embryos of each indicated genotype ± standard deviation. Bars: A–F, 400 μm; G–J, 100 μm.
Figure 5.
Figure 5.
Foxp1flox/flox:Nkx2.5-cre mutants exhibit DORV and VSDs. H + E staining of wild type (A–D) and Foxp1flox/flox:Nkx2.5-cre mutants (E–H) at E14.5 showing the aorta exiting from the right ventricle (arrows, F,G) and a VSD (white arrow, H). Bar, 200 μm.
Figure 6.
Figure 6.
Foxp1flox/flox:Nkx2.5-cre mutants have increased myocardial proliferation as well as alterations in myocardial differentiation. (A–C) Ki67/MF20 coimmunostaining in Foxp1flox/flox:Nkx2.5-cre mutants is increased in comparison with wild-type littermates at E14.5 and E16.5. (D) This increased proliferation is observed in both the compact and trabecular zones. (E) Cell cycle factor expression is altered in Foxp1flox/flox:Nkx2.5-cre mutants. (F) Expression of α-MHC and β-MHC is altered in Foxp1flox/flox:Nkx2.5-cre mutants. Proliferation assessments were made on three embryos of each indicated genotype/condition, and the data represent the average ± S.E.M. Q-PCR data represent the average of three different assays performed in triplicate ± SEM. All data are considered significant using Student's t-test. (*) P < 0.05; (**) P < 0.01. Bar, 50 μm.
Figure 7.
Figure 7.
ChIP-seq analysis identifies Nkx2.5 as a target of Foxp1 transcriptional repression. ChIP-seq data showing peaks with forkhead DNA-binding sites (red bar), peaks unique to Foxp1 antibody ChIP-seq analysis but lacking forkhead DNA-binding sites (blue bars), and peaks that were also observed in control IgG ChIP-seq analysis (black bar). (A) ChIP-seq analysis identifies two peaks in the Nkx2.5 locus that contain conserved forkhead DNA-binding sites (peaks 4 and 6). (B) Expression of Nkx2.5 is decreased by ∼20% in Nkx2.5-cre hearts but is elevated in Foxp1flox/flox:Nkx2.5-cre hearts at E14.5. Of note, the Nkx2.5-cre mice were used as controls in these experiments to control for the loss of one Nkx2.5 allele. (C) Foxp1 expression represses the −3-kb mouse Nkx2.5 promoter/enhancer in a dose-dependent manner. Directed ChIP using primers in Supplemental Table 1 show high-level association of Foxp1 with peak regions 4 and 6 using agarose gel analysis (D) and real-time Q-PCR (E). Q-PCR data represent the average of three different assays performed in triplicate ± SEM. All data are considered significant using Student's t-test. (*) P < 0.05; (**) P < 0.01.
Figure 8.
Figure 8.
Increased Nkx2.5 expression leads to increased ventricular wall thickness and myocardial proliferation. (A) The β-MHC promoter was use to overexpress Nkx2.5 in transgenic mice. (B–D) Genotype-positive embryos exhibited increased ventricular wall thickness compared with wild-type littermates. (E) Expression of Nkx2.5 is increased in βMHC-Nkx2.5 transgenic hearts. (F,G) The increase in ventricular wall thickness in βMHC-Nkx2.5 transgenic hearts at E16.5 is similar to that observed in Foxp1flox/flox:Nkx2.5-cre mutants at the same age. (H–J) βMHC-Nkx2.5 transgenic hearts exhibit a significant increase in proliferation, as measured by Ki67/MF20 coimmunostaining. (K) Expression of cyclin D1 and p27 is elevated in βMHC-Nkx2.5 transgenic hearts. (L) Expression of α-MHC is decreased and expression of β-MHC is increased in βMHC-Nkx2.5 transgenic hearts. Proliferation assessments were made on two embryos of each indicated genotype/condition, and the data represent the average ± SEM. Q-PCR data represent the average of three different assays performed in triplicate ± SEM. All data are considered significant using Student's t-test unless otherwise noted. (n.s.) Not significant; (*) P < 0.05; (**) P < 0.01. Bars: B–D, 300 μm; H,I, 100 μm.
Figure 9.
Figure 9.
Model of how Foxp1 regulates the balance of cardiomyocyte proliferation by targeting different pathways in the endocardium and myocardium. Foxp1 expression in the myocardium targets Nkx2.5 expression, leading to increased Nkx2.5 expression, increased proliferation, and decreased maturation. Conversely, Foxp1 expression in the endocardium represses Sox17 expression, which, through regulation of β-catenin activity, controls Fgf16/20 expression.

Similar articles

Cited by

References

    1. Bergman LM, Birts CN, Darley M, Gabrielli B, Blaydes JP 2009. CtBPs promote cell survival through the maintenance of mitotic fidelity. Mol Cell Biol 29: 4539–4551 - PMC - PubMed
    1. Bergmann O, Bhardwaj RD, Bernard S, Zdunek S, Barnabe-Heider F, Walsh S, Zupicich J, Alkass K, Buchholz BA, Druid H, et al. 2009. Evidence for cardiomyocyte renewal in humans. Science 324: 98–102 - PMC - PubMed
    1. Bersell K, Arab S, Haring B, Kuhn B 2009. Neuregulin1/ErbB4 signaling induces cardiomyocyte proliferation and repair of heart injury. Cell 138: 257–270 - PubMed
    1. Brunkow ME, Jeffery EW, Hjerrild KA, Paeper B, Clark LB, Yasayko SA, Wilkinson JE, Galas D, Ziegler SF, Ramsdell F 2001. Disruption of a new forkhead/winged-helix protein, scurfin, results in the fatal lymphoproliferative disorder of the scurfy mouse. Nat Genet 27: 68–73 - PubMed
    1. Chamorro MN, Schwartz DR, Vonica A, Brivanlou AH, Cho KR, Varmus HE 2005. FGF-20 and DKK1 are transcriptional targets of β-catenin and FGF-20 is implicated in cancer and development. EMBO J 24: 73–84 - PMC - PubMed

Publication types

MeSH terms