. 2010 Aug 23;190(4):533-9.
doi: 10.1083/jcb.201002108. Epub 2010 Aug 16.

Regulation of the autophagy protein LC3 by phosphorylation

Affiliations

Regulation of the autophagy protein LC3 by phosphorylation

Salvatore J Cherra 3rd et al. J Cell Biol. .

Abstract

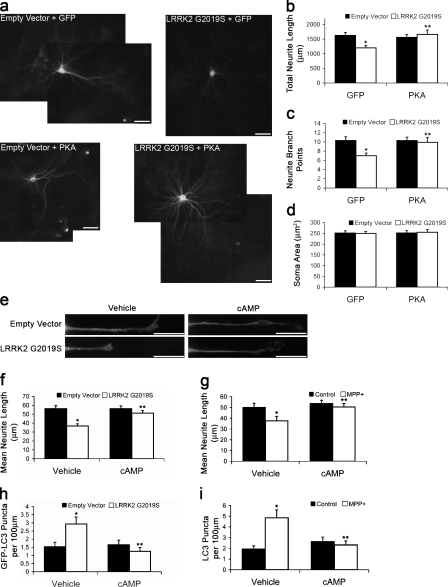
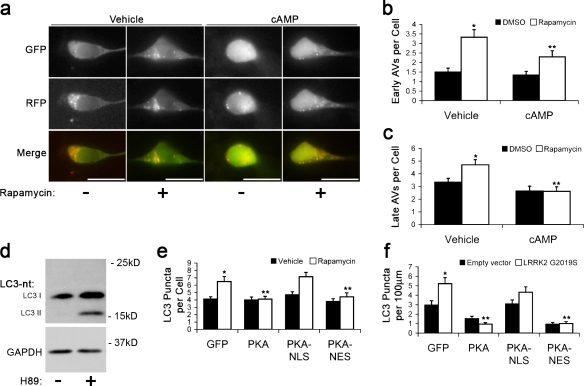
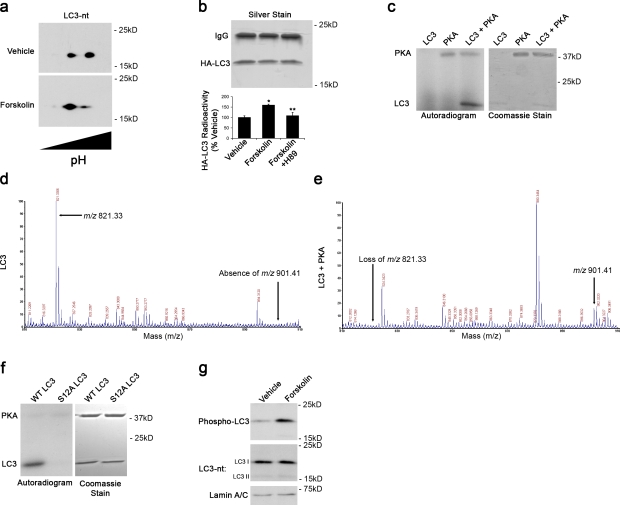
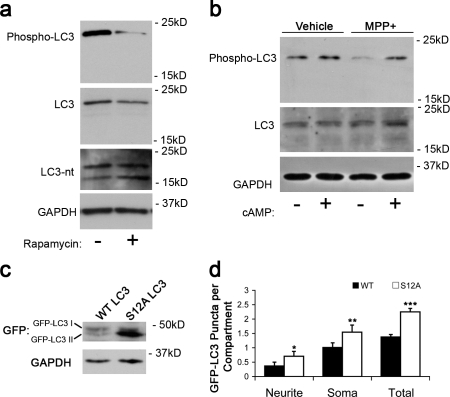
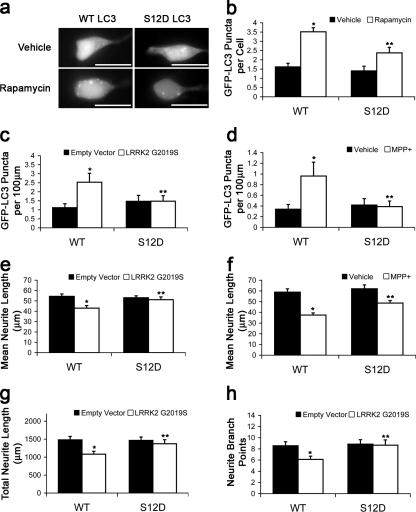
Macroautophagy is a major catabolic pathway that impacts cell survival, differentiation, tumorigenesis, and neurodegeneration. Although bulk degradation sustains carbon sources during starvation, autophagy contributes to shrinkage of differentiated neuronal processes. Identification of autophagy-related genes has spurred rapid advances in understanding the recruitment of microtubule-associated protein 1 light chain 3 (LC3) in autophagy induction, although braking mechanisms remain less understood. Using mass spectrometry, we identified a direct protein kinase A (PKA) phosphorylation site on LC3 that regulates its participation in autophagy. Both metabolic (rapamycin) and pathological (MPP(+)) inducers of autophagy caused dephosphorylation of endogenous LC3. The pseudophosphorylated LC3 mutant showed reduced recruitment to autophagosomes, whereas the nonphosphorylatable mutant exhibited enhanced puncta formation. Finally, autophagy-dependent neurite shortening induced by expression of a Parkinson disease-associated G2019S mutation in leucine-rich repeat kinase 2 was inhibited by dibutyryl-cyclic adenosine monophosphate, cytoplasmic expression of the PKA catalytic subunit, or the LC3 phosphorylation mimic. These data demonstrate a role for phosphorylation in regulating LC3 activity.


Figures

Figure 1.
Figure 1.
PKA signaling reduces neurite injury and autophagy. (a–d) Mouse cortical neurons coexpressing GFP or GFP-PKA and LRRK2 G2019S or vector 7 d after transfection. (b) Quantification of neurite lengths. *, P = 0.001 versus empty vector/GFP; **, P = 0.007 versus LRRK2 G2019S/GFP (n = 50–60 cells/condition). (c) Quantification of branch points. *, P = 0.001 versus empty vector/GFP; **, P = 0.015 versus LRRK2 G2019S/GFP (n = 50–60 cells/condition). (d) Quantification of soma area (n = 50–60 cells/condition). (e, f, and h) SH-SY5Y neurites expressing GFP-LC3 48 h after transfection with/without cAMP for 24 h. (f) Quantification of neurite lengths. *, P = 1.48 × 10⁻⁵ versus empty vector/vehicle; **, P = 9.21 × 10⁻⁵ versus LRRK2 G2019S/vehicle (n = 80–90 cells/condition). (g) Quantification of neurite lengths from MPP+-treated SH-SY5Y cells with/without cAMP for 48 h. *, P = 0.0298 versus control/vehicle; **, P = 0.0166 versus MPP+/vehicle (n = 50–60 cells/condition). (h) Quantification of GFP-LC3–labeled puncta with/without cAMP for 24 h. *, P = 0.006 versus empty vector/vehicle; **, P = 6.58 × 10⁻⁴ versus LRRK2 G2019S/vehicle (n = 80–90 cells/condition). (i) Quantification of GFP-LC3 puncta from MPP+-treated SH-SY5Y cells with/without cAMP. *, P = 6.06 × 10⁻⁴ versus control/vehicle; **, P = 0.004 versus MPP+/vehicle (n = 50–55 cells/condition). Error bars indicate mean ± SEM. Bars, 20 µm.
Figure 2.
Figure 2.
Cytoplasmic PKA inhibits autophagy. (a) RFP-GFP-LC3–labeled AVs in SH-SY5Y cells treated with rapamycin ± cAMP for 1 h. (b) Quantification of early AVs (GFP+ RFP+ puncta) in SH-SY5Y cells cotreated with rapamycin and cAMP for 3 h. *, P = 2.65 × 10⁻⁶ versus vehicle lacking rapamycin; **, P = 0.001 versus vehicle with rapamycin (n = 45–50 cells/condition). (c) Quantification of late AVs (RFP+-only puncta) in SH-SY5Y cells cotreated with rapamycin and cAMP for 3 h. *, P < 0.008 versus vehicle without rapamycin; **, P < 0.05 versus vehicle with rapamycin (n = 50–55 cells/condition). (d) LC3 immunoblot of SH-SY5Y cells treated with H89 or vehicle for 1 h. (e) Quantification of endogenous LC3-immunolabeled AVs in SH-SY5Y cells after 1-h treatment with rapamycin or DMSO (vehicle). *, P = 0.003 versus vehicle/GFP; **, P < 0.013 versus rapamycin/GFP (n = 35–45 cells/condition). (f) Quantification of endogenous LC3-immunolabeled AVs in SH-SY5Y cells 48 h after transfection. *, P = 3.52 × 10⁻⁴ versus empty vector/GFP group; **, P < 4.66 × 10⁻⁵ versus LRRK2 G2019S/GFP group (n = 80–90 cells/condition). Error bars indicate mean ± SEM. Bars, 20 µm.
Figure 3.
Figure 3.
PKA directly phosphorylates LC3. (a) 2D immunoblot probed for LC3 shows distinct species differing by isoelectric points. Forskolin increases abundance of species with a more acidic isoelectric point. (b) Metabolic labeling reveals greater 32P incorporation in HA-LC3 immunoprecipitated from forskolin-treated cells compared with control cells. Error bars indicate mean ± SEM. *, P < 0.05 versus vehicle; **, P < 0.05 versus forskolin (n = 3 independent experiments). (c) In vitro kinase assay with recombinant PKA and purified rat LC3. Phosphorylation was detected by autoradiography. Coomassie stain shows migration of the recombinant proteins. (d and e) Recombinant LC3 was incubated with ATP in the presence and absence of PKA. In the presence of PKA and ATP, the m/z 821.33 ion is lost with the appearance of an m/z 901.41 ion. (f) Mutation of the LC3 phosphorylation site to S12A abolishes PKA phosphorylation of LC3. (g) Immunoblot of cortical neurons treated with forskolin or DMSO (vehicle) probed with phospho-specific LC3 antibody, total LC3 antibody (LC3-nt), and lamin antibody as a loading control.
Figure 4.
Figure 4.
LC3 dephosphorylation is associated with enhanced recruitment to autophagosomes. (a and b) Immunoblots of SH-SY5Y cells treated with rapamycin for 1 h (a) or MPP+ for 24 h (b) were probed using the phospho-specific antibody, a C-terminal LC3 antibody (LC3), an N-terminal LC3 antibody (LC3-nt), and GAPDH as loading control. (c) Immunoblotting of SH-SY5Y cells expressing GFP-LC3–WT or –S12A reveals that a greater fraction of GFP-LC3–S12A migrates as LC3-II. (d) Quantification of GFP-LC3 puncta in SH-SY5Y cells expressing GFP-LC3–WT or –S12A. *, P = 0.023 versus WT neurite; **, P = 0.014 versus WT soma; ***, P = 0.003 versus WT total (n = 100–115 cells/condition). Error bars indicate mean ± SEM.
Figure 5.
Figure 5.
LC3 phosphomimic shows reduced recruitment and suppresses neurite degeneration. (a and b) SH-SY5Y cells expressing GFP-LC3–WT or –S12D treated with rapamycin or vehicle for 1 h. Quantification of GFP-LC3 puncta. *, P = 2.31 × 10⁻⁸ versus vehicle/WT; **, P = 0.004 versus rapamycin/WT (n = 70–80 cells/condition). (c) Quantification of GFP-LC3 puncta in SH-SY5Y 48 h after transfection. *, P = 0.001 versus empty vector/GFP-LC3–WT; **, P = 0.025 versus LRRK2 G2019S/GFP-LC3–WT (n = 100–115 cells/condition). (d) Quantification of GFP-LC3 puncta in SH-SY5Y cells treated with MPP+ or vehicle for 48 h. *, P = 0.026 versus vehicle/WT; **, P = 0.043 versus MPP+/WT (n = 85–95 cells/condition). (e) Quantification of neurite lengths from SH-SY5Y cells 48 h after transfection. *, P = 6.37 × 10⁻⁴ versus empty vector/WT; **, P = 0.008 versus LRRK2 G2019S/WT (n = 100–115 cells/condition). (f) Quantification of neurite lengths from SH-SY5Y cells treated with MPP+ or vehicle for 48 h. *, P = 3.58 × 10⁻⁸ versus vehicle/WT; **, P = 3.74 × 10⁻⁴ versus MPP+/WT (n = 85–95 cells/condition). (g and h) Quantification of neurite length and branch points in cortical neurons coexpressing either GFP-LC3–WT or –S12A with empty vector or LRRK2 G2019S. *, P < 0.01 versus empty vector/WT; **, P < 0.036 versus LRRK2 G2019S/WT (n = 30–40 cells/condition). Error bars indicate mean ± SEM. Bars, 20 µm.

References

    1. Bok J., Zha X.M., Cho Y.S., Green S.H. 2003. An extranuclear locus of cAMP-dependent protein kinase action is necessary and sufficient for promotion of spiral ganglion neuronal survival by cAMP. J. Neurosci. 23:777–787 - PMC - PubMed
    1. Boland B., Nixon R.A. 2006. Neuronal macroautophagy: from development to degeneration. Mol. Aspects Med. 27:503–519 10.1016/j.mam.2006.08.009 - DOI - PubMed
    1. Budovskaya Y.V., Stephan J.S., Reggiori F., Klionsky D.J., Herman P.K. 2004. The Ras/cAMP-dependent protein kinase signaling pathway regulates an early step of the autophagy process in Saccharomyces cerevisiae. J. Biol. Chem. 279:20663–20671 10.1074/jbc.M400272200 - DOI - PMC - PubMed
    1. Budovskaya Y.V., Stephan J.S., Deminoff S.J., Herman P.K. 2005. An evolutionary proteomics approach identifies substrates of the cAMP-dependent protein kinase. Proc. Natl. Acad. Sci. USA. 102:13933–13938 10.1073/pnas.0501046102 - DOI - PMC - PubMed
    1. Chalovich E.M., Zhu J.H., Caltagarone J., Bowser R., Chu C.T. 2006. Functional repression of cAMP response element in 6-hydroxydopamine-treated neuronal cells. J. Biol. Chem. 281:17870–17881 10.1074/jbc.M602632200 - DOI - PMC - PubMed

Publication types

MeSH terms