. 2010 Aug 23;190(4):675-91.
doi: 10.1083/jcb.201002119. Epub 2010 Aug 16.

Clathrin-independent carriers form a high capacity endocytic sorting system at the leading edge of migrating cells

Affiliations

Clathrin-independent carriers form a high capacity endocytic sorting system at the leading edge of migrating cells

Mark T Howes et al. J Cell Biol. .

Abstract

Although the importance of clathrin- and caveolin-independent endocytic pathways has recently emerged, key aspects of these routes remain unknown. Using quantitative ultrastructural approaches, we show that clathrin-independent carriers (CLICs) account for approximately three times the volume internalized by the clathrin-mediated endocytic pathway, forming the major pathway involved in uptake of fluid and bulk membrane in fibroblasts. Electron tomographic analysis of the 3D morphology of the earliest carriers shows that they are multidomain organelles that form a complex sorting station as they mature. Proteomic analysis provides direct links between CLICs, cellular adhesion turnover, and migration. Consistent with this, CLIC-mediated endocytosis of key cargo proteins, CD44 and Thy-1, is polarized at the leading edge of migrating fibroblasts, while transient ablation of CLICs impairs their ability to migrate. These studies provide the first quantitative ultrastructural analysis and molecular characterization of the major endocytic pathway in fibroblasts, a pathway that provides rapid membrane turnover at the leading edge of migrating cells.


Figures

Figure 1.
Figure 1.
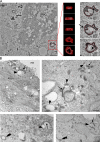
CTxB does not affect CLIC endocytosis. (A) Cav1−/− MEFs were incubated with HRP in the presence or absence of CTxB for 15 s. Cells were cooled and DAB reaction perfomed in the presence of ascorbic acid (AA) before fixation. Bars, 200 nm. (B) Quantitation of the number of HRP-filled carriers per cell across 10–12 cells treated as in A. CLICs were defined by their characteristic ring-shaped morphology, CCVs were defined as coated vesicular carriers. Error bars show SEM. (C) Cav1−/− MEFs were grown in normal media (plus energy), media containing 2-deoxyglucose (no energy), or 2-deoxyglucose media for 1 h followed by a 1-h washout in normal media (recovery) before CTxB-HRP internalization and DAB reaction. Labeled structures were counted across 10 cells. Error bars show SEM. (D and E) Cav1−/− MEFs were incubated with CTxB-HRP for 5 min before the DAB reaction for either 5 min at 37°C or 10 min at 4°C, followed by fixation at 37°C. All CTxB-HRP–positive structures were counted in 10–12 cells across two independent experiments. Error bars show SEM. Bar, 200 nm. (F) NIH3T3s were treated for 20 min with vehicle (Untreated) or Dyngo4a before internalization of CTxB-555 (left panels) and Tf-647 (right panels) for 5 min. Cells were placed on ice and acid stripped to remove surface labeling. Cells were then bound with CTxB-488 (middle panels). Bar, 10 µm. (G) NIH3T3 cells were left untreated or were treated with Dyngo4a before internalization of CTxB-HRP, followed by DAB reaction. Arrows show CTxB-HRP–laden CLICs, double arrowheads show internalized, labeled CCVs, arrowheads show surface connected unlabeled CCPs. Bars, 200 nm.
Figure 2.
Figure 2.
Quantitation of CLIC endocytosis. (A) Cav1−/− or wild-type (WT) MEFs were left untreated or were treated with Dyngo4a. CTxB-HRP was internalized for 15 s, 1 min, or 2 min. Examples of CTxB-labeled structures after 15 s of uptake are shown (inset, left panel). Substratum indicated by large arrowhead, grid sizes are 2,000 or 200 nm, examples of intersections shown by arrows. (B) 20–25 cells treated as in A were used to calculate the volume fraction (V(v)). Error bars show SEM. (C) NIH3T3 cells not treated with inhibitor were processed as in A and counted as in B. V(v) was calculated for both tubular and vesicular structures. Error bars show SEM. (D) Cav1−/− MEFs were incubated with HRP for 15 s, 1 min or 2 min and HRP-laden carriers counted as in B. Error bars show SEM. (E) CTxB was conjugated with NHS-SS-biotin and added to untreated Cav1−/− MEFs or Cav1−/− MEFs treated with Dyngo4a for 15 s or 2 min or was bound to untreated cells on ice for 10 min (Surface + MesNa). Cells were placed on ice and residual surface biotin cleaved with MesNa. Western blots of cell lysates were probed with streptavidin-HRP. Chart represents the average intensity of streptavidin-HRP across three independent experiments. Residue luminescence in Surface + MesNa samples indicates level of uncleavable biotin. Error bars show SEM. (F) Absolute volume of CLICs was estimated from the volume fraction, V(v), multiplied by the average volume of a Cav1−/− MEF, 2,347 µm2. Surface density (S(v)) was calculated from high resolution images of labeled structures using a cycloid grid as described in Materials and methods and multiplied by the absolute volume to give absolute surface area. Volume of a single carrier was calculated as described in Materials and methods. Number of CLIC budding events per minute per cell was calculated based on the absolute volume internalized by all CLICs divided by the volume of a single carrier. Volume adjustments for overprojection effects are in brackets (see Materials and methods).
Figure 3.
Figure 3.
3D morphology of CLICs. (A) Cav1−/− MEFs were incubated with CTxB-HRP for 20 min on ice, before internalization for 15 s. The DAB reaction was performed and cells were processed for electron tomography (see Materials and methods). A single section of the original tomogram is shown (left). Various rotations of a 3D contoured electron density render were generated (middle). Enlarged sections selected from the tomogram (right) show internal vesicles (arrows) and a complete connection around the circumference of the structure (arrowhead). (B) WT MEFs grown on sapphire discs were incubated with CTxB-HRP for 15 s before DAB reaction and high-pressure freezing. Tubular extensions (large arrows) are seen emanating from vesicular bulbs (arrowheads) in the characteristic ring-shaped CLIC morphology. CCPs without CTxB label (double arrowheads) indicate that they are still surface connected. Bars, 200 nm.
Figure 4.
Figure 4.
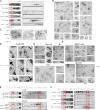
Biochemical enrichment of CLICs. (A) 3T3-GPI cells were subjected to density fractionation as described in Materials and methods. Western blots of membrane markers are shown. Within the first gradient (left) anti-GFP–, Cav1-, and Grp78-positive membranes are present in Fraction 1.2, highlighted by outline. CHC-, GM130-, and TfR-positive membranes are below the detection limit within this fraction. Within the second gradient, anti-GFP–positive membranes concentrate within Fraction 2.8, highlighted by outline. This represnts a yield of 9.6 ± 0.2% of anti-GFP–positive membranes. Cav1 concentrates in Fraction 2.6 and Grp78 in Fraction 2.10. (B) Fraction 2.8 was fixed and visualized by EM. Structures within Fraction 2.8 share similar profiles to CLICs seen within intact cells. Bar, 200 nm. (C) High resolution electron micrographs of Fraction 2.8 structures, providing examples of vesiculation (arrows) and a spherical bulb connected to tubular extension (arrowheads). Bar, 100 nm. (D) NIH3T3 cells were incubated with CTxB-HRP before fractionation and the DAB reaction was performed on Fraction 2.8. Bar, 200 nm. (E) NIH3T3 cells transfected with Cdc42-WT or -DN were incubated with CTxB before fractionation. Western blots were probed with anti-CTxB. 3T3-GPI cells were treated or not with mβCD before incubation with anti-GFP antibodies. Western blots of fractions were probed with anti–Rb-HRP. (F) Western blots of fractions from cells transfected with Flot1-HA, GRAF1-myc, or left untransfected. Fractions were probed with anti-HA, -myc, -dynamin, -Flotillin1, or -GRAF1 antibodies as appropriate. (G) Fixed sampled from F of Fraction 2.8 were labeled for anti-HA, anti-myc, endogenous Cav1, or dynamin. Structures labeled with Flotillin-1-HA, GRAF1-myc, and dynamin (arrows) or Cav-1 (arrowheads) are shown. Bars, 200 nm.
Figure 5.
Figure 5.
Verification of novel CLIC cargo. (A) NIH3T3 cells were incubated with either anti–Thy-1 or anti-CD44 antibodies and CTxB-555 and Tf-647 for 2 min. Myoferlin was detected after fixation, showing steady-state localization. Arrows indicate colocalization. Bar, 10 µm. (B) 3T3-GPI cells were left untreated or were treated with 100 nM wortmannin before internalization of anti-GFP for 10 min. Arrows indicate colocalization. Bar, 10 µm. (C) Quantitation of B from 12–15 cells in three independent experiments. (D) Quantitation of colocalization between internalized anti-CD44 antibodies and Tf-647, CTxB-555, or anti-myc antibodies for GFP-dysferlin-myc–expressing cells after 2, 10, and 40 min. Error bars show SEM. (E) Anti–CD44-HRP was internalized into WT MEFs before DAB reaction. Arrows show anti-CD44-HRP–positive carriers with morphology of CLICs. Arrowheads show large, tubular ring-shaped anti-CD44-HRP–positive compartment. Bars, 200 nm. (F) Anti–CD44-HRP or Tf-HRP was pulsed into Cav1−/− MEFs for 15 s, 1 min, or 2 min. Cells were fixed and processed for vertical sections. Arrows show HRP-labeled carriers. Bar, 200 nm. (G) Stereology measurements were captured across 20–25 cells in three independent areas as treated in F. Error bars show SEM.
Figure 6.
Figure 6.
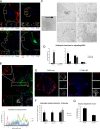
CLICs become polarized during and are necessary for efficient cellular migration. (A) Confluent monolayers of WT MEFs or NIH3T3s were scratched and cells were allowed to migrate for 8–12 h. CTxB-555 and Tf-647 were pulsed into migrating cells for 2 min in the presence of anti-CD44 (WT MEF), anti-GFP (GFP-GPI expressing WT MEF), or anti-Thy-1 (NIH3T3) antibodies or cells were labeled for Cav-1 (WT MEF). Dotted lines indicate leading edges. Arrows show colocalization between anti-CD44 or anti–Thy-1 and CTxB-555 but not Tf-647 at the leading edge. Bar, 20 µm. (B) Quantitation of average pixel intensity from the leading to trailing edges for CTxB-555, Cav-1, and Tf-647. Inset shows the concentration of tubular, Cav-1, and Tf-negative CTxB-labeled CLICs at the leading edge. A rectangular area, outlined, was used to calculate the average pixel intensity (along the y axis) across the leading to trailing edge (along the x axis) for each endocytic marker. Plot profiles identify a concentration of CTxB in the leading edge and Cav-1 in the trailing edge whereas Tf shows uniform intensity across the cell. Bar, 10 µm. (C) Electron micrographs of a migrating WT MEF. Large arrow indicates direction of migration. Magnifications from the leading edge and the trailing edge show representative images of CTxB-HRP–labeled CLICs (1, 2) and surface-connected caveolae (3, 4). Bar, 500 nm. (D) Quantitation of the number of endocytic structures at the leading and trailing edge of cells treated as in C. Budded caveolae and CCVs are positive for CTxB-HRP label, whereas caveolae and CCPs are not. Error bars show SEM. (E) WT MEFs were incubated with or without CTxB-HRP for 2 min. The DAB reaction was performed on live cells for 5 min. Cells were washed and allowed to grow for a further 4 h. CTxB-555, anti-CD44 antibodies, and Tf-647 were added directly to cells for 2 min of uptake before acid stripping and fixation. Bar, 10 µm. (F) 12–15 cells treated as in E were quantitated for average fluorescence intensity of CTxB-555, Tf-647, or goat anti–mouse-488 for mouse–anti-CD44. (G) Confluent monolayers of WT MEFs were scratched and cells were allowed to migrate into the space for 1 h. Cells were incubated with serum alone or serum with 10 µg ml−1 CTxB-HRP for 2 min and the DAB reaction was performed as in E. After 4 h of migration, cells were fixed and distance migrated was determined by measuring the distance of the gap between both sides of the wound at time zero and after 4 h of incubation. Error bars show SEM from three independent experiments.
Figure 7.
Figure 7.
Model of CLIC endocytosis. (A) (1) CLIC cargo, such as Thy-1, CD44, and myoferlin are concentrated within Flotillin-1 and cholesterol-enriched microdomains. (2) Actin and GRAF-1 drive the initial formation of the carriers, within 15 s. (3) Recruitment of dynamin, Rab11, and Rab5/EEA-1 complexes within 2 min provides the ability for these carriers to facilitate bulk membrane flow to early endosomes (4a) and fast plasma membrane recycling (4b). (B) After abrasion to the PM an influx of Ca2+ activates the fusogenic C2 domains of dysferlin/myoferlin, resulting in the preferential recycling of the CLIC pathway.

References

    1. Bernatchez P.N., Acevedo L., Fernandez-Hernando C., Murata T., Chalouni C., Kim J., Erdjument-Bromage H., Shah V., Gratton J.P., McNally E.M., et al. 2007. Myoferlin regulates vascular endothelial growth factor receptor-2 stability and function. J. Biol. Chem. 282:30745–30753 10.1074/jbc.M704798200 - DOI - PubMed
    1. Bretscher A., Reczek D., Berryman M. 1997. Ezrin: a protein requiring conformational activation to link microfilaments to the plasma membrane in the assembly of cell surface structures. J. Cell Sci. 110:3011–3018 - PubMed
    1. Chadda R., Howes M.T., Plowman S.J., Hancock J.F., Parton R.G., Mayor S. 2007. Cholesterol-sensitive Cdc42 activation regulates actin polymerization for endocytosis via the GEEC pathway. Traffic. 8:702–717 10.1111/j.1600-0854.2007.00565.x - DOI - PMC - PubMed
    1. Cheng Z.J., Singh R.D., Sharma D.K., Holicky E.L., Hanada K., Marks D.L., Pagano R.E. 2006. Distinct mechanisms of clathrin-independent endocytosis have unique sphingolipid requirements. Mol. Biol. Cell. 17:3197–3210 10.1091/mbc.E05-12-1101 - DOI - PMC - PubMed
    1. Conner S.D., Schmid S.L. 2003. Regulated portals of entry into the cell. Nature. 422:37–44 10.1038/nature01451 - DOI - PubMed

Publication types

MeSH terms