. 2010 Aug 31;107(35):15653-8.
doi: 10.1073/pnas.1007424107. Epub 2010 Aug 16.

Quantitative phosphoproteomic analysis reveals cAMP/vasopressin-dependent signaling pathways in native renal thick ascending limb cells

Affiliations

Quantitative phosphoproteomic analysis reveals cAMP/vasopressin-dependent signaling pathways in native renal thick ascending limb cells

Ruwan Gunaratne et al. Proc Natl Acad Sci U S A. .

Abstract

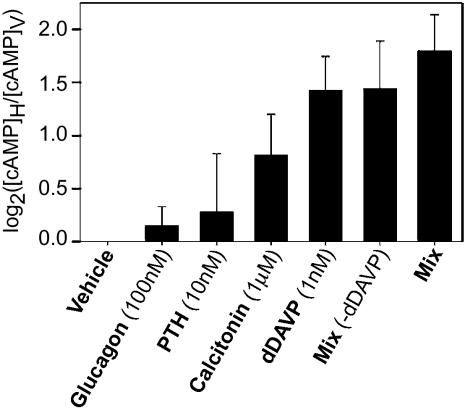
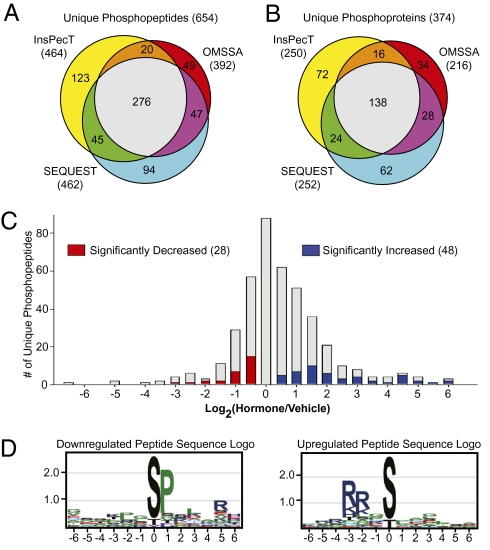
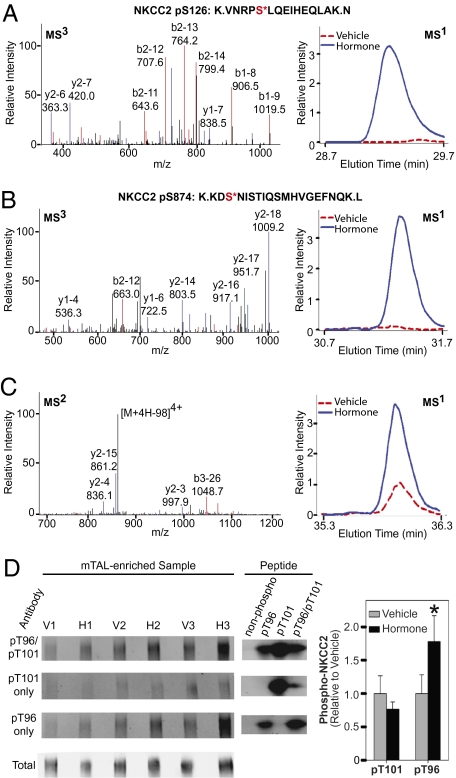
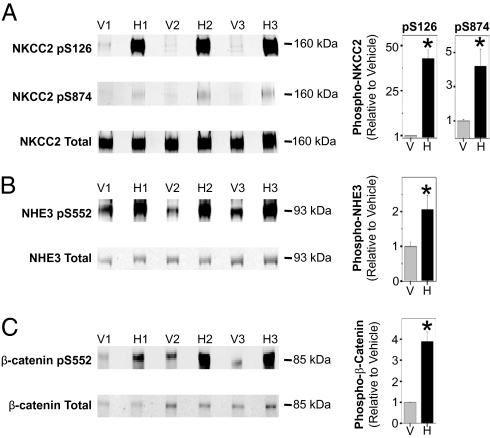
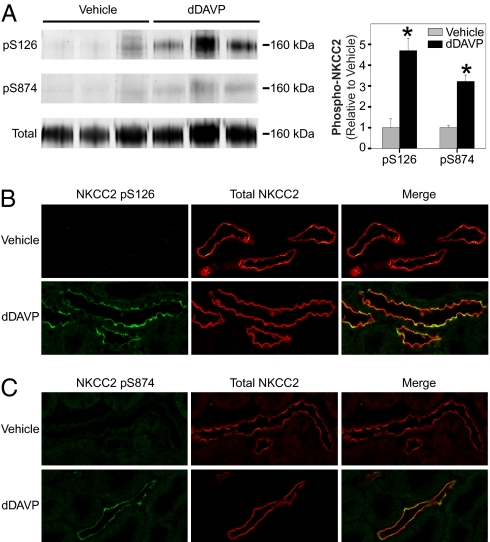
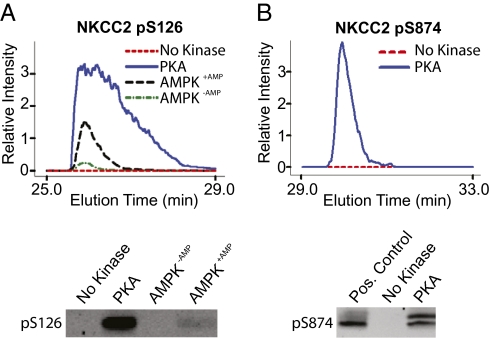
Quantitative mass spectrometry was used to identify hormone-dependent signaling pathways in renal medullary thick ascending limb (mTAL) cells via phosphoproteomic analysis. Active transport of NaCl across the mTAL epithelium is accelerated by hormones that increase cAMP levels (vasopressin, glucagon, parathyroid hormone, and calcitonin). mTAL suspensions from rat kidneys were exposed (15 min) to a mixture of these four hormones. Tryptic phosphopeptides (immobilized metal affinity chromatography-enriched) were identified and quantified by mass spectrometry (LTQ-Orbitrap) using label-free methodology. We quantified a total of 654 phosphopeptides, of which 414 were quantified in three experimental pairs (hormone vs. vehicle). Of these phosphopeptides, 82% were statistically unchanged in abundance in response to the hormone mixture. In contrast, 48 phosphopeptides were significantly increased, whereas 28 were significantly decreased. The population of up-regulated phosphopeptides was highly enriched in basophilic kinase substrate motifs (AGC or calmodulin-sensitive kinase families), whereas the down-regulated sites were dominated by "proline-directed" motifs (cyclin-dependent or MAP kinase families). Bioinformatic classification uncovered overrepresentation of transmembrane transporters, protein phosphatase regulators, and cytoskeletal binding proteins among the regulated proteins. Immunoblotting with phospho-specific antibodies confirmed cAMP/vasopressin-dependent phosphorylation at Thr96, Ser126, and Ser874 of the Na(+):K(+):2Cl(-) cotransporter NKCC2, at Ser552 of the Na(+):H(+) exchanger NHE3, and at Ser552 of beta-catenin. Vasopressin also increased phosphorylation of NKCC2 at both Ser126 (more than fivefold) and Ser874 (more than threefold) in rats in vivo. Both sites were phosphorylated by purified protein kinase A during in vitro assays. These results support the view that, although protein kinase A plays a central role in mTAL signaling, additional kinases, including those that target proline-directed motifs, may be involved.


Conflict of interest statement

The authors declare no conflict of interest.

Figures

Fig. 1.
Fig. 1.
Cellular cAMP following hormone stimulation. Measurements made in presence of IBMX (0.5 mM). dDAVP is a V2-receptor selective vasopressin analog. Error bars indicate SEM (n = 3).
Fig. 2.
Fig. 2.
Phosphoproteomic profiling summary. Phosphopeptides (A) and corresponding phosphoproteins (B) identified by each search engine (SEQUEST, InsPecT, and OMSSA). (C) Distribution of changes in abundance of individual phosphorylation sites in response to hormone treatment (significantly decreased, red; significantly increased, blue). (D) Amino acid residue/position pairs overrepresented in sets of phosphopeptides whose abundances are significantly decreased (Left) or significantly increased (Right).
Fig. 3.
Fig. 3.
NKCC2 phosphorylation. (A) pSer126-NKCC2 peptide. Typical MS3 spectrum (Left) and representative MS1 time-course curve (Right). (B) pSer874-NKCC2 peptide. (C) MS2 spectrum (Left) for identified NKCC2 monophosphopeptide containing known phosphorylation sites at Thr96 and Thr101 (TDTTFHAYDSHTNTYYLQTFGHNTMDAVPK). Site specification cannot be determined. (Right) Representative MS1 curves. (D) Immunoblots probed with R5 antibody (Top) or R5 antibody preadsorbed with synthetic peptides singly phosphorylated at either Thr96 or Thr101. (Bottom) “Total” immunoblot was probed with holo-NKCC2 antibody. (Middle) Controls in which synthetic phospho- and nonphospho-peptides were run on immunoblot and probed with designated antibodies. Bar graph shows results of densitometry analysis of immunoblots. H, hormone treated; V, vehicle. Error bars indicate SEM (n = 3). The asterisk indicates statistical significance (P < 0.05).
Fig. 4.
Fig. 4.
Immunoblot confirmation of regulated sites. Immunoblotting with phospho-specific antibodies confirmed phosphorylation of NKCC2 at Ser126 (A, Top) and Ser874 (A, Middle), NHE3 at Ser552 (B, Top), and β-catenin at Ser552 (C, Top) in paired vehicle- and hormone-treated mTAL suspensions. In each case (AC), the respective holo-protein was also probed. Bar graph shows results of densitometry analysis of immunoblots. H, hormone treated; V, vehicle. Error bars indicate SEM (n = 3). The asterisk indicates statistical significance (P < 0.05).
Fig. 5.
Fig. 5.
Vasopressin effects on phosphorylation of NKCC2 in vivo. (A) Immunoblotting for NKCC2 phosphorylation at Ser126 (Top) and Ser874 (Middle) in outer medullary homogenates from vehicle- or dDAVP-treated Brattleboro rats. Total NKCC2 protein was also probed (Bottom). Bar graph shows results of densitometry analysis of immunoblots. Error bars indicate SEM (n = 3). Asterisks indicate statistical significance (P < 0.05). Immunolocalization of NKCC2 phosphorylated at Ser126 (B) and Ser874 (C) in perfusion-fixed kidneys from Brattleboro rats. Phospho-antibody, green; total NKCC2 antibody, red.
Fig. 6.
Fig. 6.
Quantification of in vitro NKCC2 phosphorylation by PKA and AMPK. (A) Representative MS1 time-course curves (Upper) quantifying phosphorylation of Ser126-containing peptide after incubation with purified PKA-α (blue) or AMPK-α2β1γ1 with (black) or without (green) 0.1 mM AMP. Immunoblotting confirmation (Lower) using pSer126-specific NKCC2 antibody. (B) Representative MS1 time-course curves (Upper) quantifying phosphorylation of S874-containing peptide after incubation with purified PKA. Immunoblotting confirmation (Lower) using pSer874-specific NKCC2 antibody.

References

    1. Kuhn W, Ramel A. Active salt transport as possible (and probable) single effect in urine concentration in the kidney. Helv Chim Acta. 1959;42:628–660. (in German)
    1. Morel F, et al. Multiple hormonal control of adenylate cyclase in distal segments of the rat kidney. Kidney Int Suppl. 1982;11:S55–S62. - PubMed
    1. Knepper MA, Hoffert JD, Packer RK, Fenton RA. In: Brenner & Rector's The Kidney. Brenner B, editor. Philadelphia: Saunders Elsevier; 2008. pp. 308–329.
    1. Knepper MA, Danielson RA, Saidel GM, Post RS. Quantitative analysis of renal medullary anatomy in rats and rabbits. Kidney Int. 1977;12:313–323. - PubMed
    1. Elias JE, Gygi SP. Target-decoy search strategy for increased confidence in large-scale protein identifications by mass spectrometry. Nat Methods. 2007;4:207–214. - PubMed

Publication types

MeSH terms

LinkOut - more resources