Tyrosine kinase 2 controls IL-1ß production at the translational level
- PMID: 20713887
- PMCID: PMC2990881
- DOI: 10.4049/jimmunol.0904000
Tyrosine kinase 2 controls IL-1ß production at the translational level
Abstract
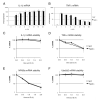
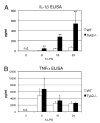
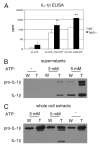
IL-1beta is an important proinflammatory cytokine with a major role in several inflammatory diseases. Expression of IL-1beta is tightly regulated at the level of transcription, mRNA stability, and proteolytic processing. In this study, we report that IL-1beta expression in response to LPS is also regulated at the translational level. LPS-induced IL-1beta protein levels in macrophages derived from murine bone marrow are markedly increased in the absence of tyrosine kinase 2 (Tyk2). Increased IL-1beta is found intra- and extracellularly, irrespective of the efficiency of IL-1beta processing. We show that the absence of Tyk2 results both in higher translational rates and in enhanced association of IL-1beta mRNA with polysomes. Induction and stability of IL-1beta mRNA are not affected by the lack of Tyk2. We show further that the Tyk2-dependent translational inhibition is mediated by autocrine/paracrine type I IFN signaling and requires signal transducer and activator of transcription 1. Enhanced IL-1beta production in Tyk2- and IFN receptor 1-deficient macrophages is also observed following Listeria monocytogenes infection. Taken together, the data describe a novel mechanism for the control of IL-1beta synthesis.
Figures


Similar articles
-
TYK2 licenses non-canonical inflammasome activation during endotoxemia.Cell Death Differ. 2021 Feb;28(2):748-763. doi: 10.1038/s41418-020-00621-x. Epub 2020 Sep 14. Cell Death Differ. 2021. PMID: 32929218 Free PMC article.
-
Re-evaluation of IL-10 signaling reveals novel insights on the contribution of the intracellular domain of the IL-10R2 chain.PLoS One. 2017 Oct 10;12(10):e0186317. doi: 10.1371/journal.pone.0186317. eCollection 2017. PLoS One. 2017. PMID: 29016674 Free PMC article.
-
TLR agonists stimulate Nlrp3-dependent IL-1β production independently of the purinergic P2X7 receptor in dendritic cells and in vivo.J Immunol. 2013 Jan 1;190(1):334-9. doi: 10.4049/jimmunol.1202737. Epub 2012 Dec 7. J Immunol. 2013. PMID: 23225887 Free PMC article.
-
Tyrosine kinase 2 (TYK2) in cytokine signalling and host immunity.Front Biosci (Landmark Ed). 2011 Jun 1;16(9):3214-32. doi: 10.2741/3908. Front Biosci (Landmark Ed). 2011. PMID: 21622231 Review.
-
Therapeutic Advantage of Tyk2 Inhibition for Treating Autoimmune and Chronic Inflammatory Diseases.Biol Pharm Bull. 2021;44(11):1585-1592. doi: 10.1248/bpb.b21-00609. Biol Pharm Bull. 2021. PMID: 34719635 Review.
Cited by
-
Clash of the Cytokine Titans: counter-regulation of interleukin-1 and type I interferon-mediated inflammatory responses.Cell Mol Immunol. 2017 Jan;14(1):22-35. doi: 10.1038/cmi.2016.25. Epub 2016 Jun 6. Cell Mol Immunol. 2017. PMID: 27264686 Free PMC article. Review.
-
Type I IFN-mediated regulation of IL-1 production in inflammatory disorders.Cell Mol Life Sci. 2012 Oct;69(20):3395-418. doi: 10.1007/s00018-012-0989-2. Epub 2012 Apr 24. Cell Mol Life Sci. 2012. PMID: 22527721 Free PMC article. Review.
-
A novel immunofluorescence detection method for renal cell-type specific in situ cytokine production by confocal microscopy.MethodsX. 2020 May 28;7:100935. doi: 10.1016/j.mex.2020.100935. eCollection 2020. MethodsX. 2020. PMID: 32577408 Free PMC article.
-
Interactions among glomerulus infiltrating macrophages and intrinsic cells via cytokines in chronic lupus glomerulonephritis.J Autoimmun. 2020 Jan;106:102331. doi: 10.1016/j.jaut.2019.102331. Epub 2019 Sep 5. J Autoimmun. 2020. PMID: 31495649 Free PMC article.
-
TYK2 licenses non-canonical inflammasome activation during endotoxemia.Cell Death Differ. 2021 Feb;28(2):748-763. doi: 10.1038/s41418-020-00621-x. Epub 2020 Sep 14. Cell Death Differ. 2021. PMID: 32929218 Free PMC article.
References
-
- Vainchenker W, Dusa A, Constantinescu SN. JAKs in pathology: role of Janus kinases in hematopoietic malignancies and immunodeficiencies. Semin. Cell Dev. Biol. 2008;19:385–393. - PubMed
-
- Schindler C, Levy DE, Decker T. JAK-STAT signaling: from interferons to cytokines. J. Biol. Chem. 2007;282:20059–20063. - PubMed
-
- Karaghiosoff M, Neubauer H, Lassnig C, Kovarik P, Schindler H, Pircher H, McCoy B, Bogdan C, Decker T, Brem G, et al. Partial impairment of cytokine responses in Tyk2-deficient mice. Immunity. 2000;13:549–560. - PubMed
-
- Shimoda K, Kato K, Aoki K, Matsuda T, Miyamoto A, Shibamori M, Yamashita M, Numata A, Takase K, Kobayashi S, et al. Tyk2 plays a restricted role in IFN alpha signaling, although it is required for IL-12-mediated T cell function. Immunity. 2000;13:561–571. - PubMed
-
- Schleicher U, Mattner J, Blos M, Schindler H, Röllinghoff M, Karaghiosoff M, Müller M, Werner-Felmayer G, Bogdan C. Control of Leishmania major in the absence of Tyk2 kinase. Eur. J. Immunol. 2004;34:519–529. - PubMed
Publication types
MeSH terms
Substances
Grants and funding
LinkOut - more resources
Full Text Sources
Other Literature Sources
Molecular Biology Databases
Research Materials

