

Regional and temporal profiles of calpain and caspase-3 activities in postnatal rat brain following repeated propofol administration
- PMID: 20714114
- PMCID: PMC3021498
- DOI: 10.1159/000316970
Regional and temporal profiles of calpain and caspase-3 activities in postnatal rat brain following repeated propofol administration
Abstract
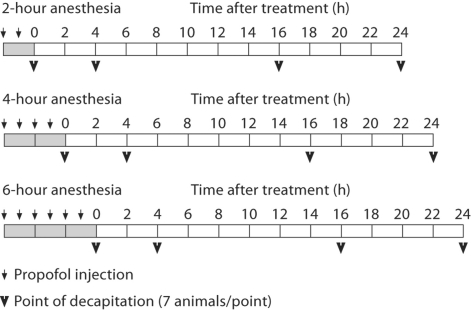
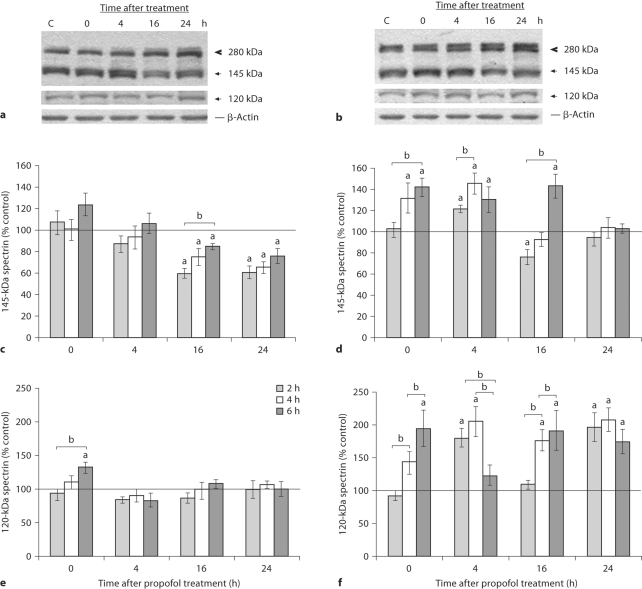
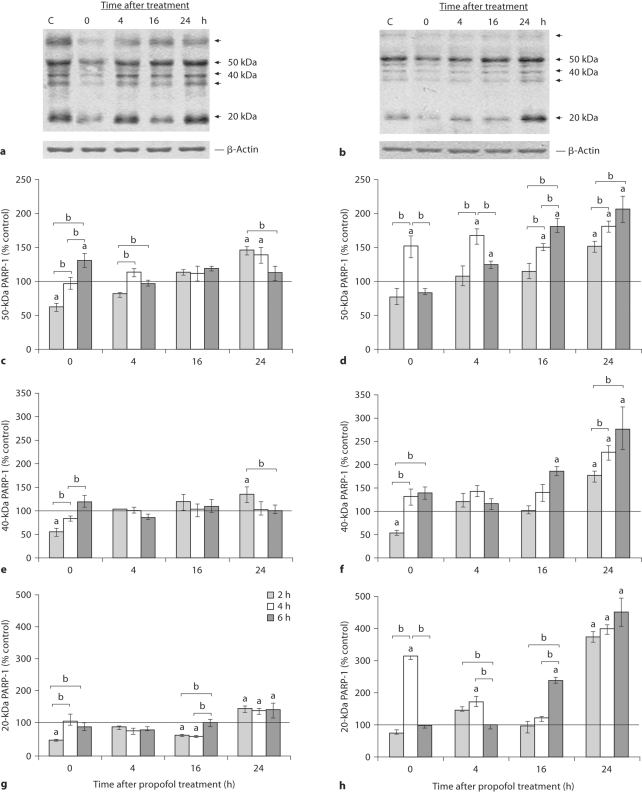
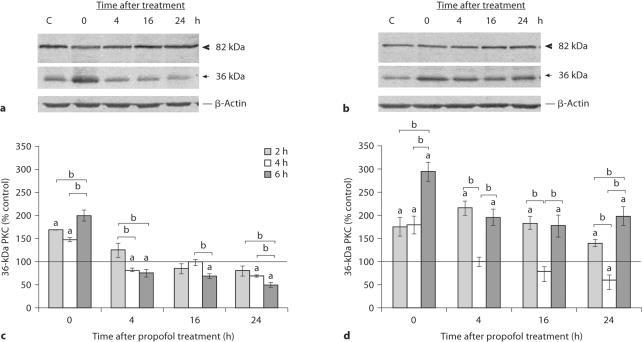
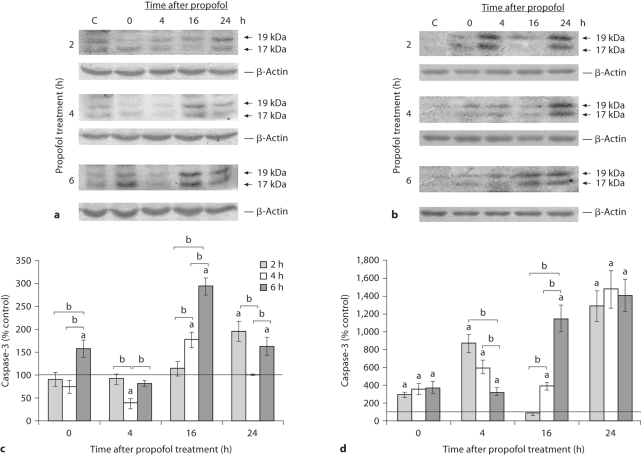
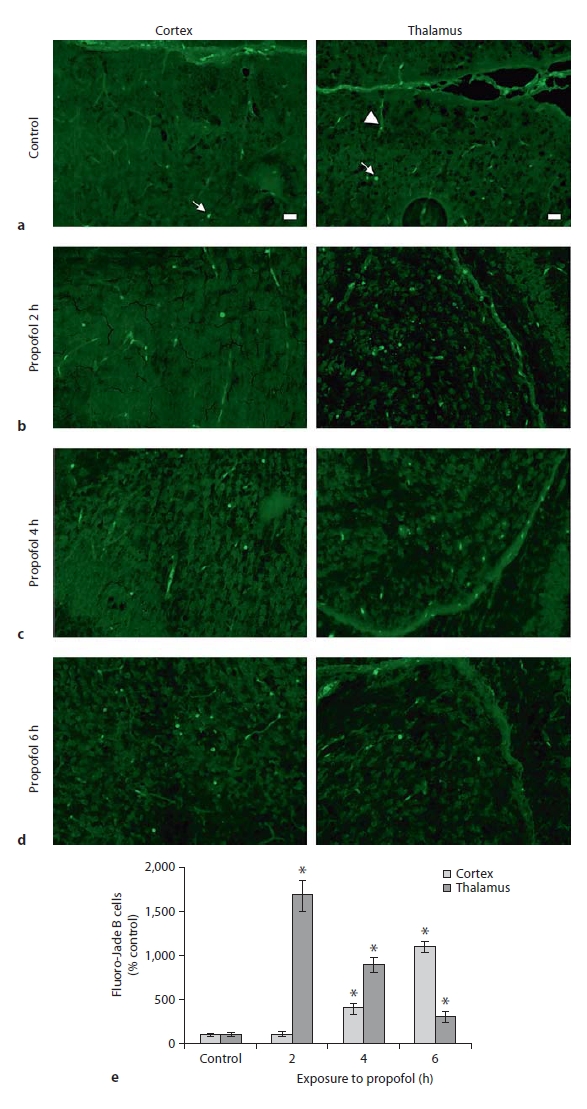
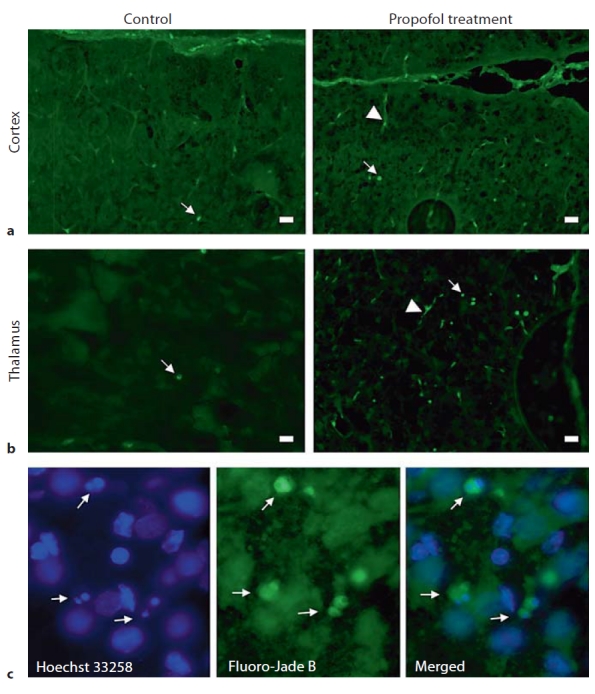
Exposure of newborn rats to a variety of anesthetics has been shown to induce apoptotic neurodegeneration in the developing brain. We investigated the effect of the general anesthetic propofol on the brain of 7-day-old (P7) Wistar rats during the peak of synaptic growth. Caspase and calpain protease families most likely participate in neuronal cell death. Our objective was to examine regional and temporal patterns of caspase-3 and calpain activity following repeated propofol administration (20 mg/kg). P7 rats were exposed for 2, 4 or 6 h to propofol and killed 0, 4, 16 and 24 h after exposure. Relative caspase-3 and calpain activities were estimated by Western blot analysis of the proteolytic cleavage products of α-II-spectrin, protein kinase C and poly(ADP-ribose) polymerase 1. Caspase-3 activity and expression displayed a biphasic pattern of activation. Calpain activity changed in a region- and time-specific manner that was distinct from that observed for caspase-3. The time profile of calpain activity exhibited substrate specificity. Fluoro-Jade B staining revealed an immediate neurodegenerative response that was in direct relationship to the duration of anesthesia in the cortex and inversely related to the duration of anesthesia in the thalamus. At later post-treatment intervals, dead neurons were detected only in the thalamus 24 h following the 6-hour propofol exposure. Strong caspase-3 expression that was detected at 24 h was not followed by cell death after 2- and 4-hour exposures to propofol. These results revealed complex patterns of caspase-3 and calpain activities following prolonged propofol anesthesia and suggest that both are a manifestation of propofol neurotoxicity at a critical developmental stage.
Copyright © 2010 S. Karger AG, Basel.
Figures
Similar articles
-
The Fas Ligand/Fas Death Receptor Pathways Contribute to Propofol-Induced Apoptosis and Neuroinflammation in the Brain of Neonatal Rats.Neurotox Res. 2016 Oct;30(3):434-52. doi: 10.1007/s12640-016-9629-1. Epub 2016 May 17. Neurotox Res. 2016. PMID: 27189477
-
[Effects of propofol on expression of hippocampal survivin and Caspase-3 in newborn rats].Zhonghua Er Ke Za Zhi. 2012 May;50(5):361-5. Zhonghua Er Ke Za Zhi. 2012. PMID: 22883038 Chinese.
-
Propofol anesthesia induces proapoptotic tumor necrosis factor-α and pro-nerve growth factor signaling and prosurvival Akt and XIAP expression in neonatal rat brain.J Neurosci Res. 2014 Oct;92(10):1362-73. doi: 10.1002/jnr.23409. Epub 2014 May 14. J Neurosci Res. 2014. PMID: 24827783 Free PMC article.
-
Potential mechanism of cell death in the developing rat brain induced by propofol anesthesia.Int J Dev Neurosci. 2009 May;27(3):279-87. doi: 10.1016/j.ijdevneu.2008.12.005. Epub 2008 Dec 27. Int J Dev Neurosci. 2009. PMID: 19150648 Free PMC article.
-
Calpain activation and alpha-spectrin cleavage in rat brain by ethanol.Neurosci Lett. 2002 Mar 22;321(3):187-91. doi: 10.1016/s0304-3940(02)00063-0. Neurosci Lett. 2002. PMID: 11880203
Cited by
-
The Fas Ligand/Fas Death Receptor Pathways Contribute to Propofol-Induced Apoptosis and Neuroinflammation in the Brain of Neonatal Rats.Neurotox Res. 2016 Oct;30(3):434-52. doi: 10.1007/s12640-016-9629-1. Epub 2016 May 17. Neurotox Res. 2016. PMID: 27189477
-
Propofol at clinically relevant concentrations increases neuronal differentiation but is not toxic to hippocampal neural precursor cells in vitro.Anesthesiology. 2012 Nov;117(5):1080-90. doi: 10.1097/ALN.0b013e31826f8d86. Anesthesiology. 2012. PMID: 23001052 Free PMC article.
-
Propofol Affects Neurodegeneration and Neurogenesis by Regulation of Autophagy via Effects on Intracellular Calcium Homeostasis.Anesthesiology. 2017 Sep;127(3):490-501. doi: 10.1097/ALN.0000000000001730. Anesthesiology. 2017. PMID: 28614084 Free PMC article.
-
Down-regulation of microRNA-21 is involved in the propofol-induced neurotoxicity observed in human stem cell-derived neurons.Anesthesiology. 2014 Oct;121(4):786-800. doi: 10.1097/ALN.0000000000000345. Anesthesiology. 2014. PMID: 24950164 Free PMC article.
-
Effect of propofol in the immature rat brain on short- and long-term neurodevelopmental outcome.PLoS One. 2013 May 30;8(5):e64480. doi: 10.1371/journal.pone.0064480. Print 2013. PLoS One. 2013. PMID: 23737984 Free PMC article.
References
-
- Loepke AW, Soriano SG. An assessment of the effects of general anesthetics on developing brain structure and neurocognitive function. Anesth Analg. 2008;106:1681–1707. - PubMed
-
- Fredriksson A, Ponten E, Gordh T, Eriksson P. Neonatal exposure to a combination of N-methyl-D-aspartate and γ-aminobutyric acid type A receptor anesthetic agents potentiates apoptotic neurodegeneration and persistent behavioral deficits. Anesthesiology. 2007;107:427–435. - PubMed
-
- Bercker S, Bert B, Bittigau P, Felderhoff-Muser U, Buhrer C, Ikonomidou C, Weise M, Kaisers UX, Kerner T. Neurodegeneration in newborn rats following propofol and sevoflurane anesthesia. Neurotox Res. 2009;16:140–147. - PubMed
-
- Vutskits L, Gascon E, Tassonyi E, Kiss JZ. Clinically relevant concentrations of propofol but not midazolam alter in vitro denditic development of isolated γ-aminobutiric acid-positive interneurons. Anesthesiology. 2005;102:970–976. - PubMed
Publication types
MeSH terms
Substances
Grants and funding
LinkOut - more resources
Full Text Sources
Research Materials
