. 2010 Aug 1;9(15):3119-26.
doi: 10.4161/cc.9.15.12526.

Cyclin T1 overexpression induces malignant transformation and tumor growth

Affiliations

Cyclin T1 overexpression induces malignant transformation and tumor growth

Cristian Moiola et al. Cell Cycle. .

Abstract

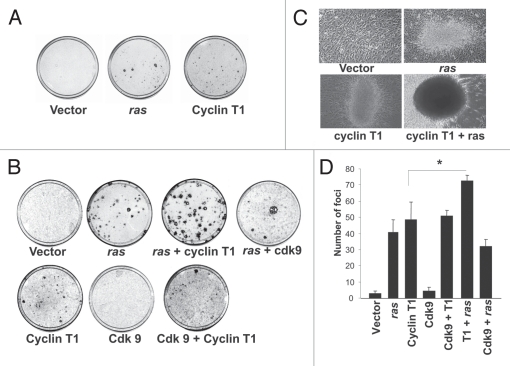
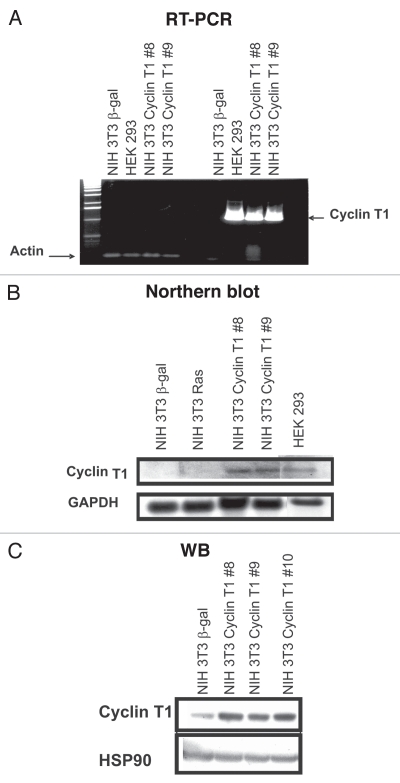
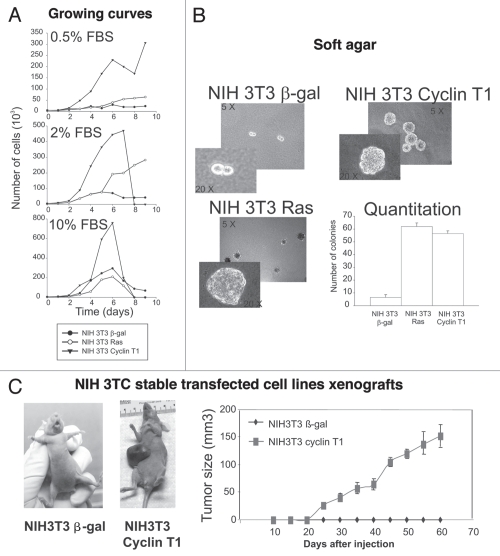
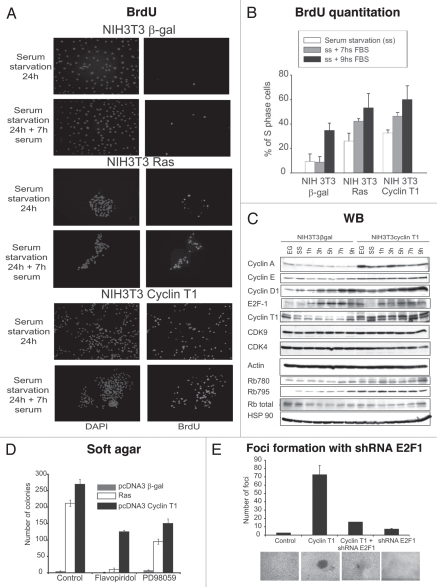
Human PTE Fb is a protein kinase composed by CDK9 and Cyclin T that controls the elongation phase of RNA Pol II. This complex also affects the activation and differentiation program of lymphoid cells. In this study we found that several head and neck tumor cell lines overexpress PTE Fb. We also established that Cyclin T1 is able to induce transformation in vitro, as we determined by foci and colony formation assays. Nu/nu mice s.c. injected with stable transfected Cyclin T1 cells (NIH 3T3 Cyclin T1) developed tumors faster than animals injected with control cells (NIH 3T3 beta-gal). In vitro, NIH 3T3 Cyclin T1 cells show increased proliferation and CDK4-Rb phosphorylation. Even more, silencing E2F1 expression (shRNA E2F1) in NIH 3T3 cells resulted in a dramatic inhibition of Cyclin T1-induced foci. All these data demonstrate for the first time the Cyclin T1 oncogenic function and suggest a role for this protein in controlling cell cycle probably via Rb/E2F1 pathway.


Figures

Figure 1
Figure 1
PTEFb is increased in head and neck human tumor cell lines. Head and neck tumor cell lines (HaCaT, IHOK, 15b, HN4, HN6, HN12, HN13, HN30 and HN31) or normal keratinocytes (NHEK) were analyzed by western blot using anti-Cyclin T1, anti-CDK9 or anti-HSP90 antibodies.
Figure 2
Figure 2
Cyclin T1 induces foci formation in NIH 3T3 cells. (A) pcDNA3 β-gal (vector), pcDNA3 Ras or pcDNA3 Cyclin T1 were transfected in NIH 3T3 cells for the focus formation assay as described in Materials and Methods. (B) pcDNA3 β-gal (vector), pcDNA3 Ras, pcDNA3 Cyclin T1 or pcDNA3 Cdk9 and the combinations detailed were transfected in NIH 3T3 cells for the focus formation assay as described in Materials and Methods. (C) Morphology foci were observed at the microscope and photographed. (D) Average ± Standard deviation of number of foci from three independent experiments were plotted.
Figure 3
Figure 3
NIH 3T3 Cyclin T1 clones overexpresses Cyclin T1. RNA from stable transfected cell lines (NIH 3T3 Cyclin T1, NIH 3T3 Ras or NIH 3T3 β-gal) was isolated and (A) RT-PCR; or (B) Northern blot analysis was performed. Human specific primers and PCR generated probe were designed, respectively. Human HEK 293 cell line also was used as positive control. (C) NIH 3T3 Cyclin T1, NIH 3T3 Ras and NIH 3T3 β-gal were analyzed by western blot using anti-Cyclin T1 and anti-HSP90 antibodies.
Figure 4
Figure 4
NIH 3T3 Cyclin T1 clones show increased proliferation, colony formation and tumor growth. (A) NIH 3T3 Cyclin T1, NIH 3T3 Ras or NIH 3T3 β-gal clones were grown in the presence of different percentage of serum (0.5; 2 or 10%) and number of cells was determined every day during 10 days. (B) Colony formation assays were performed for the NIH 3T3 stable transfected clones as described in Materials and Methods. Average ± Standard deviation of number of colonies from three independent experiments were plotted. (C) NIH 3T3 Cyclin T1 or NIH 3T3 β-gal clones were s.c. injected in nu/nu mice as described in Materials and Methods. Average ± standard deviation of the tumor volumes were determined.
Figure 5
Figure 5
NIH 3T3 Cyclin T1 clones show increased proliferation and Rb phosphorylation. (A) NIH 3T3 Cyclin T1, NIH 3T3 Ras or NIH 3T3 β-gal clones were starved and then grown in the absence or presence of serum (7 h). BrdU analysis was performed as described in Materials and Methods. (B) BrdU quantitation is shown as % of S-phase cells. (C) NIH 3T3 Cyclin T1 or NIH 3T3 β-gal clones were grown in complete medium (10% FBS) (EG); serum starved (ss) or starved and then grown in the presence of serum for different times (1, 3, 5, 7 or 9 h). Western blot were performed using the detailed antibodies. (D) Colony formation assays were performed for the NIH 3T3 stable transfected clones as described in Materials and Methods and the cells were incubated in media with Flavopiridol (3 nM), PD98059 (500 nM) or DMSO. Average ± Standard deviation of number of colonies from two independent experiments were plotted. (E) pcDNA3 β-gal (vector), pcDNA3 Cyclin T1 and/or shRNA E2F1 plasmids were transfected in NIH 3T3 cells for the focus formation assay as described in Materials and Methods.

Comment in

References

    1. Morgan DO. Cyclin-dependent kinases: engines, clocks and microprocessors. Annu Rev Cell Dev Biol. 1997;13:261–291. - PubMed
    1. MacLachlan TK, Sang N, Giordano A. Cyclins, cyclin-dependent kinases and cdk inhibitors: implications in cell cycle control and cancer. Crit Rev Eukaryot Gene Expr. 1995;5:127–156. - PubMed
    1. Malumbres M, Barbacid M. Cell cycle, CDKs and cancer: a changing paradigm. Nat Rev Cancer. 2009;9:153–166. - PubMed
    1. Hartwell LH, Kastan MB. Cell cycle control and cancer. Science. 1994;266:1821–1828. - PubMed
    1. Sherr CJ. Cancer cell cycles. Science. 1996;274:1672–1677. - PubMed

Publication types

MeSH terms