

C-reactive protein levels and body mass index: elucidating direction of causation through reciprocal Mendelian randomization
- PMID: 20714329
- PMCID: PMC4783860
- DOI: 10.1038/ijo.2010.137
C-reactive protein levels and body mass index: elucidating direction of causation through reciprocal Mendelian randomization
Abstract
Context: The assignment of direction and causality within networks of observational associations is problematic outside randomized control trials, and the presence of a causal relationship between body mass index (BMI) and C-reactive protein (CRP) is disputed.
Objective: Using reciprocal Mendelian randomization, we aim to assess the direction of causality in relationships between BMI and CRP and to demonstrate this as a promising analytical technique.
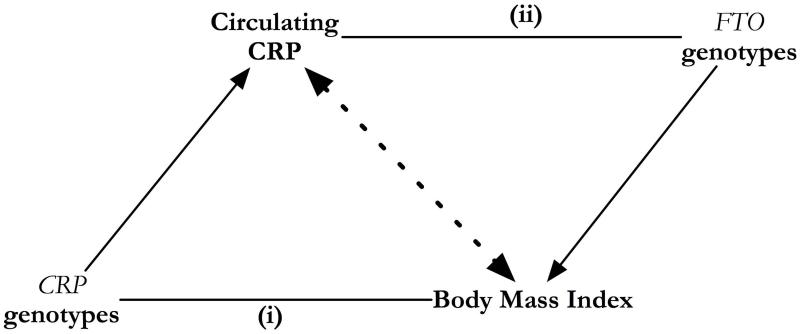
Participants and methods: The study was based on a large, cross-sectional European study from Copenhagen, Denmark. Genetic associates of BMI (FTO(rs9939609)) and circulating CRP (CRP(rs3091244)) have been used to reexamine observational associations between them.
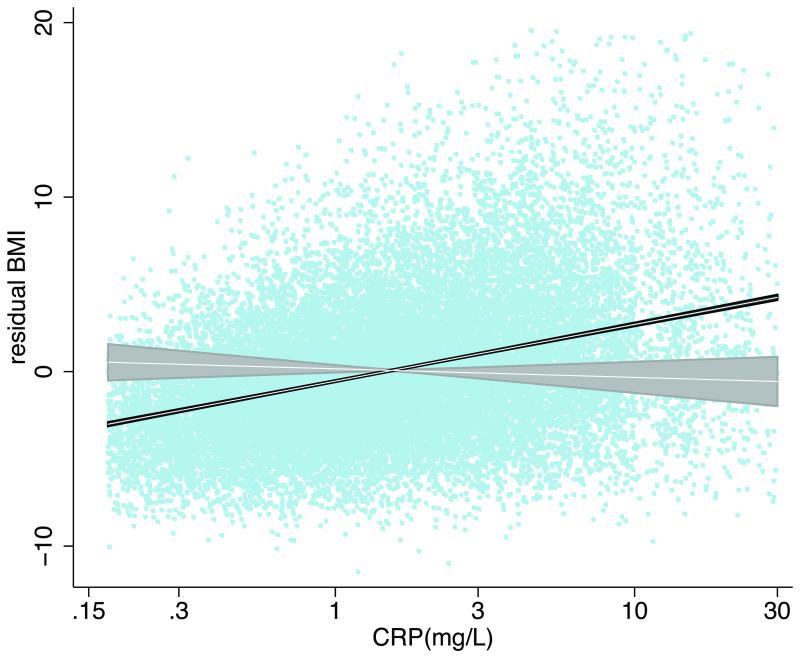
Results: Observational analyses showed a strong, positive association between circulating CRP and BMI (change in BMI for a doubling in log CRP of 1.03 kg m(-2) (95% confidence interval (95% CI): 1.00, 1.07), P<0.0001). Analysis using CRP(rs3091244) to re-estimate the causal effect of circulating CRP on BMI yielded null effects (change in BMI for a doubling in log CRP of -0.24 kg m(-2) (95% CI: -0.58, 0.11), P=0.2). In contrast, analysis using FTO(rs9939609) to assess the causal effect of BMI on circulating CRP confirmed observational associations (ratio of geometric means of CRP per s.d. increase in BMI 1.41 (95% CI: 1.10, 1.80), P=0.006).
Conclusions: Taken together, these data suggest that the observed association between circulating CRP and measured BMI is likely to be driven by BMI, with CRP being a marker of elevated adiposity. More generally, the method of reciprocal randomization has general applicability in determining the direction of causation within inter-correlated networks of metabolic components.
Figures

Similar articles
-
Unraveling the directional link between adiposity and inflammation: a bidirectional Mendelian randomization approach.J Clin Endocrinol Metab. 2010 Jan;95(1):93-9. doi: 10.1210/jc.2009-1064. Epub 2009 Nov 11. J Clin Endocrinol Metab. 2010. PMID: 19906786 Free PMC article.
-
The effect of elevated body mass index on ischemic heart disease risk: causal estimates from a Mendelian randomisation approach.PLoS Med. 2012;9(5):e1001212. doi: 10.1371/journal.pmed.1001212. Epub 2012 May 1. PLoS Med. 2012. PMID: 22563304 Free PMC article.
-
Using genetics to test the causal relationship of total adiposity and periodontitis: Mendelian randomization analyses in the Gene-Lifestyle Interactions and Dental Endpoints (GLIDE) Consortium.Int J Epidemiol. 2015 Apr;44(2):638-50. doi: 10.1093/ije/dyv075. Epub 2015 Jun 6. Int J Epidemiol. 2015. PMID: 26050256 Free PMC article.
-
Childhood, adolescent, and adulthood adiposity are associated with risk of PCOS: a Mendelian randomization study with meta-analysis.Hum Reprod. 2023 Jun 1;38(6):1168-1182. doi: 10.1093/humrep/dead053. Hum Reprod. 2023. PMID: 37015099 Free PMC article.
-
Global assessment of C-reactive protein and health-related outcomes: an umbrella review of evidence from observational studies and Mendelian randomization studies.Eur J Epidemiol. 2021 Jan;36(1):11-36. doi: 10.1007/s10654-020-00681-w. Epub 2020 Sep 25. Eur J Epidemiol. 2021. PMID: 32978716 Free PMC article.
Cited by
-
Prevalence of idiopathically elevated ESR and CRP in patients undergoing primary total knee arthroplasty as a function of body mass index.J Clin Orthop Trauma. 2020 Oct;11(Suppl 5):S722-S728. doi: 10.1016/j.jcot.2020.05.031. Epub 2020 May 29. J Clin Orthop Trauma. 2020. PMID: 32999546 Free PMC article.
-
Allopurinol is Associated with an Increased Risk of Cerebral Infarction: A Two-Sample Mendelian Randomization Study.ACS Omega. 2024 Jul 25;9(31):33826-33832. doi: 10.1021/acsomega.4c03483. eCollection 2024 Aug 6. ACS Omega. 2024. PMID: 39130586 Free PMC article.
-
Caution against examining the role of reverse causality in Mendelian Randomization.Genet Epidemiol. 2021 Jul;45(5):445-454. doi: 10.1002/gepi.22385. Epub 2021 May 19. Genet Epidemiol. 2021. PMID: 34008876 Free PMC article.
-
Longitudinal associations between attachment quality in infancy, C-reactive protein in early childhood, and BMI in middle childhood: preliminary evidence from a CPS-referred sample.Attach Hum Dev. 2019 Feb;21(1):5-22. doi: 10.1080/14616734.2018.1541513. Epub 2018 Nov 8. Attach Hum Dev. 2019. PMID: 30406720 Free PMC article.
-
Retro walking treadmill training reduces C-reactive protein levels in overweight and obese young adults: A randomized comparative study.Health Sci Rep. 2023 Mar 30;6(4):e1169. doi: 10.1002/hsr2.1169. eCollection 2023 Apr. Health Sci Rep. 2023. PMID: 37008812 Free PMC article.
References
-
- Yudkin JS, Stehouwer CD, Emeis JJ, Coppack SW. C-reactive protein in healthy subjects: associations with obesity, insulin resistance, and endothelial dysfunction: a potential role for cytokines originating from adipose tissue? Arteriosclerosis, Thrombosis & Vascular Biology. 1999;19:972–978. - PubMed
-
- Dandona P, Aljada A, Bandyopadhyay A. Inflammation: the link between insulin resistance, obesity and diabetes. Trends in Immunology. 2004;25:4–7. - PubMed
-
- Dandona P, Weinstock R, Thusu K, Abdel-Rahman E, Aljada A, Wadden T. Tumor necrosis factor-alpha in sera of obese patients: fall with weight loss. Journal of Clinical Endocrinology & Metabolism. 1998;83:2907–2910. - PubMed
-
- Bochud M, Fabienne M, Marques-Vidal P, Vollenweider P, Beckmann JS, Mooser V, et al. Association between C-reactive protein and adiposity in women. Journal of Endocrinology and Metabolism. 2009 - PubMed
Publication types
MeSH terms
Substances
Grants and funding
LinkOut - more resources
Full Text Sources
Medical
Research Materials
Miscellaneous
