

An integrated micro-electro-fluidic and protein arraying system for parallel analysis of cell responses to controlled microenvironments
- PMID: 20714638
- PMCID: PMC3902009
- DOI: 10.1039/c0ib00017e
An integrated micro-electro-fluidic and protein arraying system for parallel analysis of cell responses to controlled microenvironments
Abstract
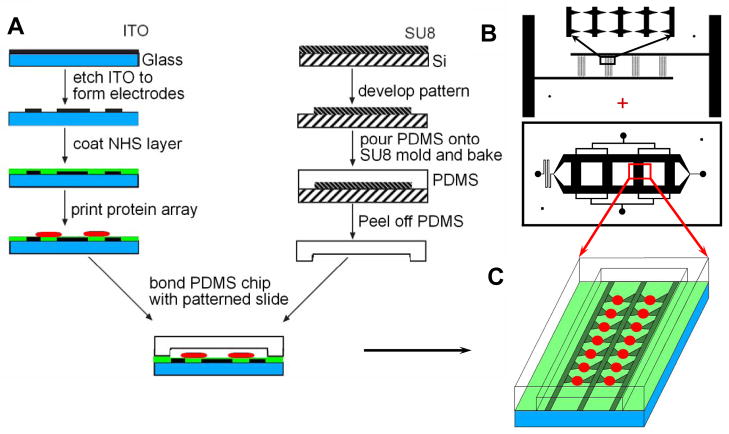
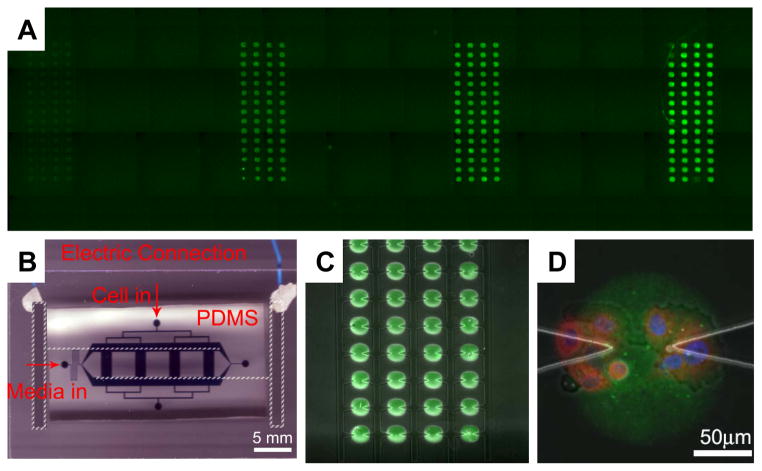
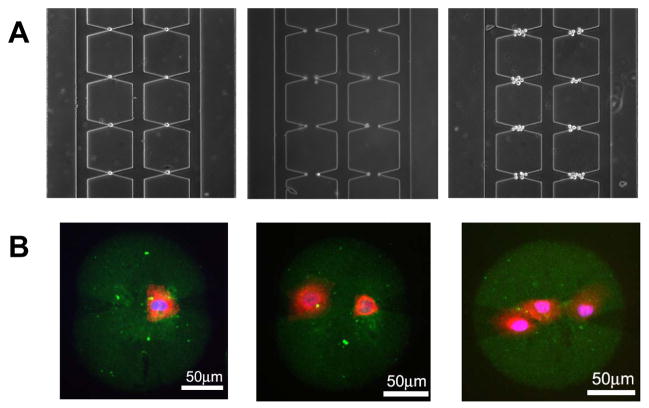
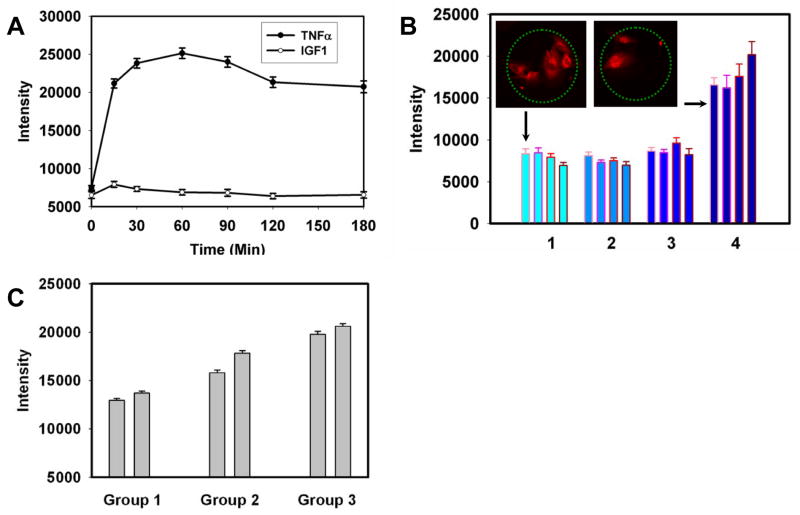
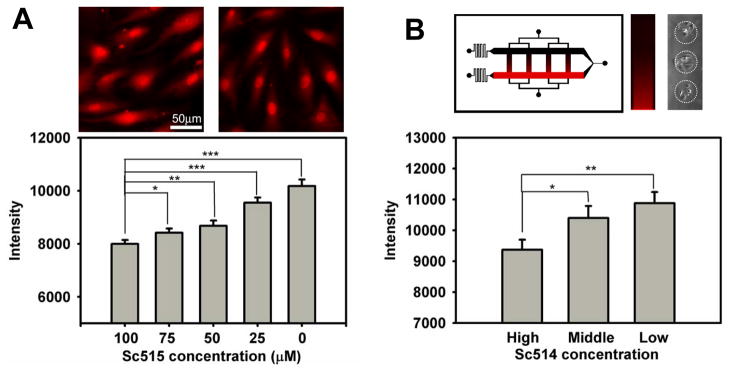
Living cells have evolved sophisticated signaling networks allowing them to respond to a wide array of external stimuli. Microfluidic devices, facilitating the analysis of signaling networks through precise definition of the cellular microenvironment often lack the capacity of delivering multiple combinations of different signaling cues, thus limiting the throughput of the analysis. To address this limitation, we developed a microfabricated platform combining microfluidic definition of the cell medium composition with dielectrophoretic definition of cell positions and protein microarray-based presentation of diverse signaling inputs. Ligands combined at different concentrations were spotted along with an extracellular matrix protein onto a glass substratum in alignment with an electrode array. This substratum was combined with a polydimethylsiloxane chip for microfluidic control of the soluble medium components, in alignment with the electrode and protein arrays. Endothelial cells were captured by dielectrophoretic force, allowed to attach and spread on the protein spots; and the signaling output of the NF-kappaB pathway in response to diverse combinations of IGF1 and TNF was investigated, in the absence and presence of variable dose of the pathway inhibitor. The results suggested that cells can be potently activated by immobilized TNF with IGF1 having a modulating effect, and the response could be abolished to different degrees by the inhibitor. This study demonstrates considerable potential of combining precise cell patterning and liquid medium control with protein microarray technology for complex cell signaling studies in a high-throughput manner.
Figures
Similar articles
-
[Inhibition of Paeoniflorin on TNF-α-induced TNF-α Receptor Type I /Nuclear Factor-κB Signal Transduction in Endothelial Cells].Zhongguo Zhong Xi Yi Jie He Za Zhi. 2016 Mar;36(3):339-44. Zhongguo Zhong Xi Yi Jie He Za Zhi. 2016. PMID: 27236893 Chinese.
-
[Regulatory effects of lanthanum chloride on the activation of nuclear factor kappa B inhibitor kinase beta induced by tumor necrosis factor alpha].Zhonghua Shao Shang Za Zhi. 2013 Dec;29(6):531-6. Zhonghua Shao Shang Za Zhi. 2013. PMID: 24495640 Chinese.
-
Transcriptional profiling of IKK2/NF-kappa B- and p38 MAP kinase-dependent gene expression in TNF-alpha-stimulated primary human endothelial cells.Blood. 2004 May 1;103(9):3365-73. doi: 10.1182/blood-2003-09-3296. Epub 2004 Jan 8. Blood. 2004. PMID: 14715628
-
"Artificial micro organs"--a microfluidic device for dielectrophoretic assembly of liver sinusoids.Biomed Microdevices. 2011 Jun;13(3):493-501. doi: 10.1007/s10544-011-9517-7. Biomed Microdevices. 2011. PMID: 21347825
-
Designing customized cell signalling circuits.Nat Rev Mol Cell Biol. 2010 Jun;11(6):393-403. doi: 10.1038/nrm2904. Epub 2010 May 19. Nat Rev Mol Cell Biol. 2010. PMID: 20485291 Free PMC article. Review.
Cited by
-
Microfluidic device for primary tumor spheroid isolation.Exp Hematol Oncol. 2017 Aug 7;6:22. doi: 10.1186/s40164-017-0084-3. eCollection 2017. Exp Hematol Oncol. 2017. PMID: 28794917 Free PMC article.
-
Micro total analysis systems for cell biology and biochemical assays.Anal Chem. 2012 Jan 17;84(2):516-40. doi: 10.1021/ac202611x. Epub 2011 Oct 21. Anal Chem. 2012. PMID: 21967743 Free PMC article. Review. No abstract available.
-
Patterned immobilization of antibodies within roll-to-roll hot embossed polymeric microfluidic channels.PLoS One. 2013 Jul 18;8(7):e68918. doi: 10.1371/journal.pone.0068918. Print 2013. PLoS One. 2013. PMID: 23874811 Free PMC article.
-
Microfluidics-Based Single-Cell Research for Intercellular Interaction.Front Cell Dev Biol. 2021 Aug 12;9:680307. doi: 10.3389/fcell.2021.680307. eCollection 2021. Front Cell Dev Biol. 2021. PMID: 34458252 Free PMC article. Review.
-
Miniaturized pre-clinical cancer models as research and diagnostic tools.Adv Drug Deliv Rev. 2014 Apr;69-70:52-66. doi: 10.1016/j.addr.2013.11.010. Epub 2013 Dec 1. Adv Drug Deliv Rev. 2014. PMID: 24295904 Free PMC article. Review.
References
Publication types
MeSH terms
Substances
Grants and funding
LinkOut - more resources
Full Text Sources
Miscellaneous
