. 2011 Jul;15(7):1505-14.
doi: 10.1111/j.1582-4934.2010.01138.x.

Survival and function of mesenchymal stem cells (MSCs) depend on glucose to overcome exposure to long-term, severe and continuous hypoxia

Affiliations

Survival and function of mesenchymal stem cells (MSCs) depend on glucose to overcome exposure to long-term, severe and continuous hypoxia

M Deschepper et al. J Cell Mol Med. 2011 Jul.

Abstract

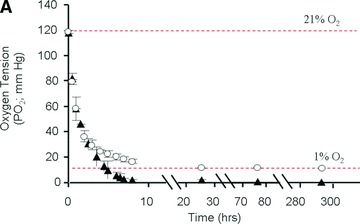
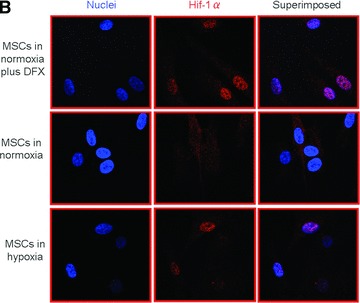
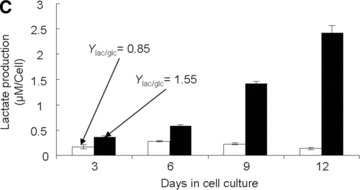
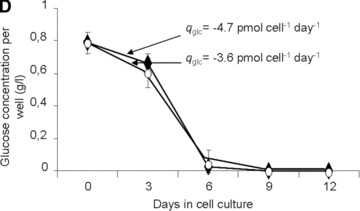
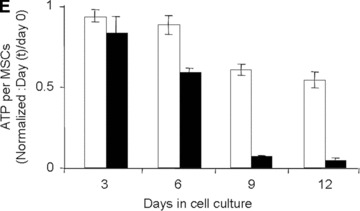
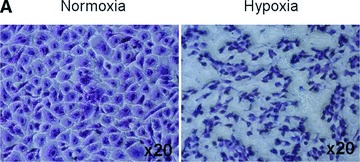
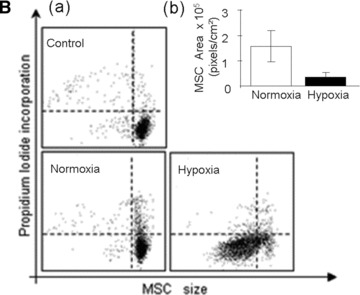
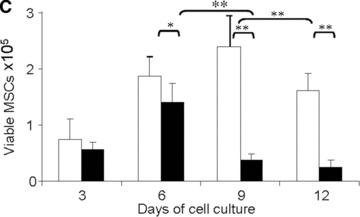
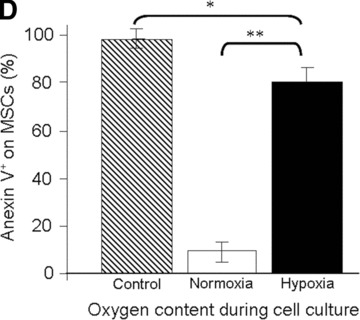
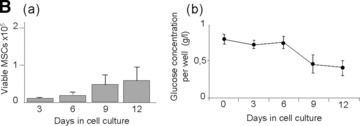
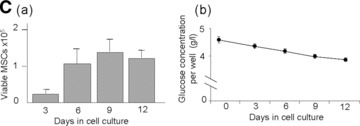
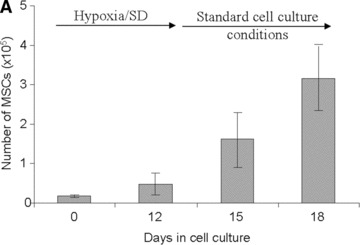
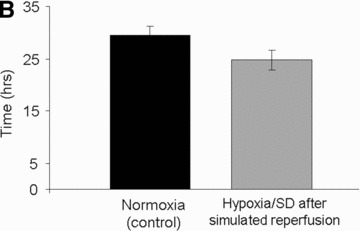
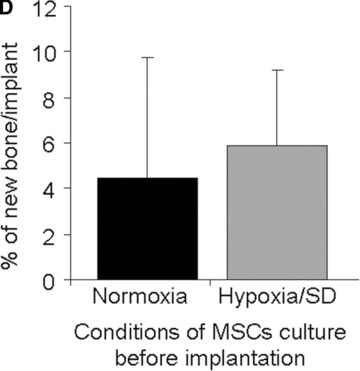
Use of mesenchymal stem cells (MSCs) has emerged as a potential new treatment for various diseases but has generated marginally successful results. A consistent finding of most studies is massive death of transplanted cells. The present study examined the respective roles of glucose and continuous severe hypoxia on MSC viability and function with respect to bone tissue engineering. We hereby demonstrate for the first time that MSCs survive exposure to long-term (12 days), severe (pO(2) < 1.5 mmHg) hypoxia, provided glucose is available. To this end, an in vitro model that mimics the hypoxic environment and cell-driven metabolic changes encountered by grafted sheep cells was established. In this model, the hallmarks of hypoxia (low pO(2) , hypoxia inducible factor-1α expression and anaerobic metabolism) were present. When conditions switched from hypoxic (low pO(2) ) to ischemic (low pO(2) and glucose depletion), MSCs exhibited shrinking, decreased cell viability and ATP content due to complete exhaustion of glucose at day 6; these results provided evidence that ischemia led to the observed massive cell death. Moreover, MSCs exposed to severe, continuous hypoxia, but without any glucose shortage, remained viable and maintained both their in vitro proliferative ability after simulation with blood reperfusion at day 12 and their in vivo osteogenic ability. These findings challenge the traditional view according to which severe hypoxia per se is responsible for the massive MSC death observed upon transplantation of these cells and provide evidence that MSCs are able to withstand exposure to severe, continuous hypoxia provided that a glucose supply is available.


Figures

Fig 1
Fig 1
Establishment and validation of the in vitro model of hypoxia. (A) Time course of oxygen tension in the presence (black triangles) and absence (open circles) of sheep MSCs. (B) HIF-1α expression when MSCs were cultured (i) in normoxia with and without desferroxamine (DFX; positive control) and (ii) in hypoxia for 24 hrs. The cell nuclei were labelled using Hoechst stain 22232 (to visualize the cell nuclei) and dylight549 (to determine the presence of HIF-1α). (C) Time course of lactate production by sheep MSCs in normoxia (white bars) and hypoxia (black bars). (D) Time course of residual glucose in MSC cultures (per well) in normoxia (white circles) and hypoxia (black triangles). (E) Normalized (to day 0) fold increase of intracellular ATP in normoxia (white bars) and in hypoxia (black bars).
Fig 1
Fig 1
Establishment and validation of the in vitro model of hypoxia. (A) Time course of oxygen tension in the presence (black triangles) and absence (open circles) of sheep MSCs. (B) HIF-1α expression when MSCs were cultured (i) in normoxia with and without desferroxamine (DFX; positive control) and (ii) in hypoxia for 24 hrs. The cell nuclei were labelled using Hoechst stain 22232 (to visualize the cell nuclei) and dylight549 (to determine the presence of HIF-1α). (C) Time course of lactate production by sheep MSCs in normoxia (white bars) and hypoxia (black bars). (D) Time course of residual glucose in MSC cultures (per well) in normoxia (white circles) and hypoxia (black triangles). (E) Normalized (to day 0) fold increase of intracellular ATP in normoxia (white bars) and in hypoxia (black bars).
Fig 2
Fig 2
Viability of MSCs: in vitro model. (A) Morphology of MSCs either maintained in normoxia or exposed to hypoxia for 12 days. Stain: haematoxylin and eosin. Light microscopy magnification: ×20. (B) FACS analysis of cell size and area of MSCs either maintained in normoxia or exposed to hypoxia for 12 days. (C) Time course of cell viability when MSCs were either maintained in normoxia (white bars) or were exposed to hypoxia (black bars). (D) FACS analysis of apoptotic MSCs stained with annexin-V following either maintenance in normoxia (white bar); hypoxia (black bar) for 12 days or positive control in normoxia (striped bar). *P < 0.05 and **P < 0.001.
Fig 2
Fig 2
Viability of MSCs: in vitro model. (A) Morphology of MSCs either maintained in normoxia or exposed to hypoxia for 12 days. Stain: haematoxylin and eosin. Light microscopy magnification: ×20. (B) FACS analysis of cell size and area of MSCs either maintained in normoxia or exposed to hypoxia for 12 days. (C) Time course of cell viability when MSCs were either maintained in normoxia (white bars) or were exposed to hypoxia (black bars). (D) FACS analysis of apoptotic MSCs stained with annexin-V following either maintenance in normoxia (white bar); hypoxia (black bar) for 12 days or positive control in normoxia (striped bar). *P < 0.05 and **P < 0.001.
Fig 3
Fig 3
Effect of glucose supply on MSCs viability and function. (A) Morphology of MSCs either maintained in normoxia (Normoxia), in serum-deprived hypoxia (Hypoxia/SD) or in high glucose hypoxia (Hypoxia/HG); Stain: haematoxylin and eosin; Light microscopy magnification: ×20. (B, a) Time course of cell viability and (B, b) residual glucose concentration in the supernatant (per well) when MSCs were cultured in serum-deprived hypoxia for 12 days. (C, a) Time course of cell viability and (C, b) residual glucose concentration in the supernatant (per well) when MSCs were cultured in high glucose hypoxia for 12 days. *P < 0.05 and **P < 0.001.
Fig 3
Fig 3
Effect of glucose supply on MSCs viability and function. (A) Morphology of MSCs either maintained in normoxia (Normoxia), in serum-deprived hypoxia (Hypoxia/SD) or in high glucose hypoxia (Hypoxia/HG); Stain: haematoxylin and eosin; Light microscopy magnification: ×20. (B, a) Time course of cell viability and (B, b) residual glucose concentration in the supernatant (per well) when MSCs were cultured in serum-deprived hypoxia for 12 days. (C, a) Time course of cell viability and (C, b) residual glucose concentration in the supernatant (per well) when MSCs were cultured in high glucose hypoxia for 12 days. *P < 0.05 and **P < 0.001.
Fig 4
Fig 4
Assessment of MSC function. (A) Number of viable MSCs before and after simulated reperfusion in hypoxia/SD in vitro. (B) Doubling time of MSCs exposed to hypoxia/SD after simulated reperfusion (grey bar) compared to that of MSCs maintained under standard culture conditions (black bar) in vitro. (C) Representative histology results of MSC-containing constructs after 2 months of subcutaneous implantation in mice: (a) Transplanted implant without MSCs, (b) transplanted implant with MSCs cultured in normoxia and (c) transplanted implant with MSCs cultured in hypoxia/SD (including magnification of new formed bone also delineated by doted black lines for quantification), before implantation. Stain: Stevenel Blue and von Gieson picro-fuchsin (bone); (magnification: ×2). (d) Magnification (×20) of new formed bone with osteocytes and lacunae (arrows). (D) New bone quantification in MSC-containing constructs after 2 months of subcutaneous implantation in mice (normalized with respect to control scaffolds without MSCs).
Fig 4
Fig 4
Assessment of MSC function. (A) Number of viable MSCs before and after simulated reperfusion in hypoxia/SD in vitro. (B) Doubling time of MSCs exposed to hypoxia/SD after simulated reperfusion (grey bar) compared to that of MSCs maintained under standard culture conditions (black bar) in vitro. (C) Representative histology results of MSC-containing constructs after 2 months of subcutaneous implantation in mice: (a) Transplanted implant without MSCs, (b) transplanted implant with MSCs cultured in normoxia and (c) transplanted implant with MSCs cultured in hypoxia/SD (including magnification of new formed bone also delineated by doted black lines for quantification), before implantation. Stain: Stevenel Blue and von Gieson picro-fuchsin (bone); (magnification: ×2). (d) Magnification (×20) of new formed bone with osteocytes and lacunae (arrows). (D) New bone quantification in MSC-containing constructs after 2 months of subcutaneous implantation in mice (normalized with respect to control scaffolds without MSCs).

Similar articles

Cited by

References

    1. Logeart-Avramoglou D, Anagnostou F, Bizios R, et al. Engineering bone: challenges and obstacles. J Cell Mol Med. 2005;9:72–84. - PMC - PubMed
    1. Quarto R, Mastrogiacomo M, Cancedda R, et al. Repair of large bone defects with the use of autologous bone marrow stromal cells. N Engl J Med. 2001;344:385–6. - PubMed
    1. Ohgushi H, Kotobuki N, Funaoka H, et al. Tissue engineered ceramic artificial joint–ex vivo osteogenic differentiation of patient mesenchymal cells on total ankle joints for treatment of osteoarthritis. Biomaterials. 2005;26:4654–61. - PubMed
    1. Kitoh H, Kitakoji T, Tsuchiya H, et al. Transplantation of marrow-derived mesenchymal stem cells and platelet-rich plasma during distraction osteogenesis–a preliminary result of three cases. Bone. 2004;35:892–8. - PubMed
    1. Vacanti CA, Bonassar LJ, Vacanti MP, et al. Replacement of an avulsed phalanx with tissue-engineered bone. N Engl J Med. 2001;344:1511–4. - PubMed