

Gill transcriptome response to changes in environmental calcium in the green spotted puffer fish
- PMID: 20716350
- PMCID: PMC3091672
- DOI: 10.1186/1471-2164-11-476
Gill transcriptome response to changes in environmental calcium in the green spotted puffer fish
Abstract
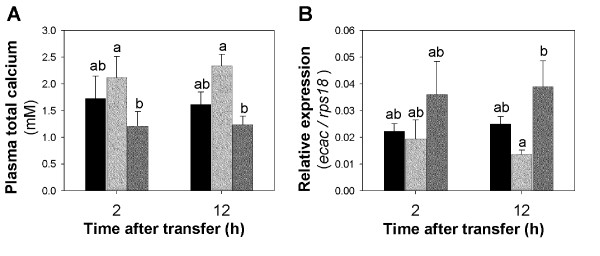
Background: Calcium ion is tightly regulated in body fluids and for euryhaline fish, which are exposed to rapid changes in environmental [Ca2+], homeostasis is especially challenging. The gill is the main organ of active calcium uptake and therefore plays a crucial role in the maintenance of calcium ion homeostasis. To study the molecular basis of the short-term responses to changing calcium availability, the whole gill transcriptome obtained by Super Serial Analysis of Gene Expression (SuperSAGE) of the euryhaline teleost green spotted puffer fish, Tetraodon nigroviridis, exposed to water with altered [Ca2+] was analysed.
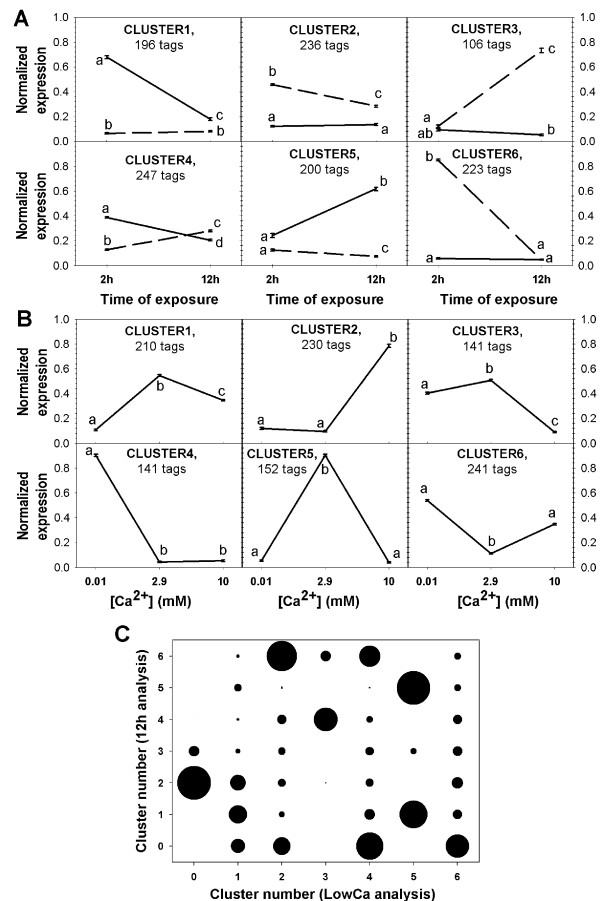
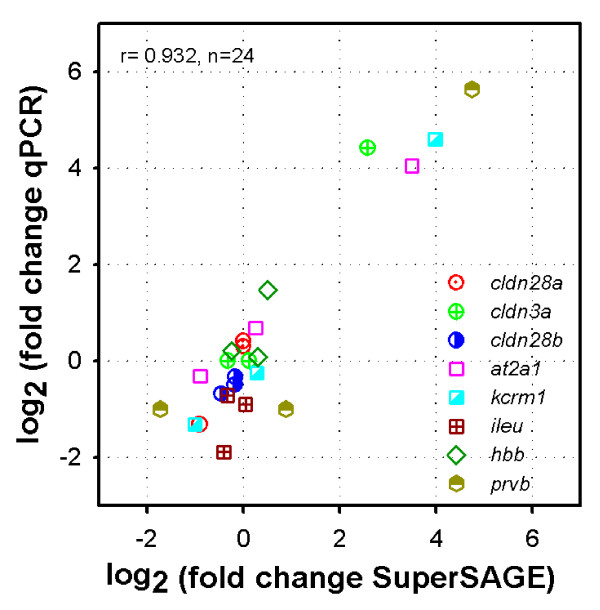
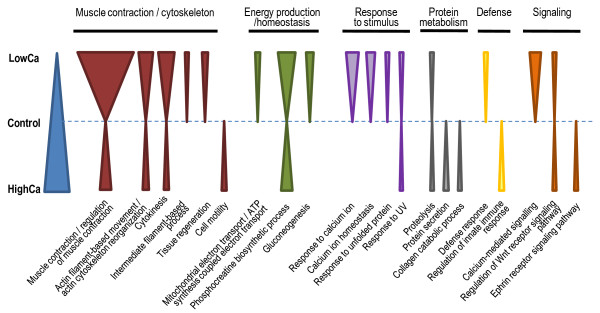
Results: Transfer of T. nigroviridis from 10 ppt water salinity containing 2.9 mM Ca2+ to high (10 mM Ca2+ ) and low (0.01 mM Ca2+) calcium water of similar salinity for 2-12 h resulted in 1,339 differentially expressed SuperSAGE tags (26-bp transcript identifiers) in gills. Of these 869 tags (65%) were mapped to T. nigroviridis cDNAs or genomic DNA and 497 (57%) were assigned to known proteins. Thirteen percent of the genes matched multiple tags indicating alternative RNA transcripts. The main enriched gene ontology groups belong to Ca2+ signaling/homeostasis but also muscle contraction, cytoskeleton, energy production/homeostasis and tissue remodeling. K-means clustering identified co-expressed transcripts with distinct patterns in response to water [Ca2+] and exposure time.
Conclusions: The generated transcript expression patterns provide a framework of novel water calcium-responsive genes in the gill during the initial response after transfer to different [Ca2+]. This molecular response entails initial perception of alterations, activation of signaling networks and effectors and suggests active remodeling of cytoskeletal proteins during the initial acclimation process. Genes related to energy production and energy homeostasis are also up-regulated, probably reflecting the increased energetic needs of the acclimation response. This study is the first genome-wide transcriptome analysis of fish gills and is an important resource for future research on the short-term mechanisms involved in the gill acclimation responses to environmental Ca2+ changes and osmoregulation.
Figures
Similar articles
-
Claudins in a primary cultured puffer fish (Tetraodon nigroviridis) gill epithelium model alter in response to acute seawater exposure.Comp Biochem Physiol A Mol Integr Physiol. 2015 Nov;189:91-101. doi: 10.1016/j.cbpa.2015.07.015. Epub 2015 Jul 31. Comp Biochem Physiol A Mol Integr Physiol. 2015. PMID: 26239219
-
Chloride channel ClC-3 in gills of the euryhaline teleost, Tetraodon nigroviridis: expression, localization and the possible role of chloride absorption.J Exp Biol. 2010 Mar 1;213(5):683-93. doi: 10.1242/jeb.040212. J Exp Biol. 2010. PMID: 20154183 Free PMC article.
-
Claudin-6, -10d and -10e contribute to seawater acclimation in the euryhaline puffer fish Tetraodon nigroviridis.J Exp Biol. 2014 May 15;217(Pt 10):1758-67. doi: 10.1242/jeb.099200. Epub 2014 Feb 13. J Exp Biol. 2014. PMID: 24526724
-
Branchial FXYD protein expression in response to salinity change and its interaction with Na+/K+-ATPase of the euryhaline teleost Tetraodon nigroviridis.J Exp Biol. 2008 Dec;211(Pt 23):3750-8. doi: 10.1242/jeb.018440. J Exp Biol. 2008. PMID: 19011216
-
Differential transcriptomic analyses revealed genes and signaling pathways involved in iono-osmoregulation and cellular remodeling in the gills of euryhaline Mozambique tilapia, Oreochromis mossambicus.BMC Genomics. 2014 Oct 23;15(1):921. doi: 10.1186/1471-2164-15-921. BMC Genomics. 2014. PMID: 25342237 Free PMC article.
Cited by
-
Generation of a reference transcriptome for evaluating rainbow trout responses to various stressors.BMC Genomics. 2011 Dec 21;12:626. doi: 10.1186/1471-2164-12-626. BMC Genomics. 2011. PMID: 22188770 Free PMC article.
-
A role for tricellulin in the regulation of gill epithelium permeability.Am J Physiol Regul Integr Comp Physiol. 2013 Jun 15;304(12):R1139-48. doi: 10.1152/ajpregu.00086.2013. Epub 2013 Apr 17. Am J Physiol Regul Integr Comp Physiol. 2013. PMID: 23594608 Free PMC article.
-
Transcriptomic Analysis of Metabolic Pathways in Milkfish That Respond to Salinity and Temperature Changes.PLoS One. 2015 Aug 11;10(8):e0134959. doi: 10.1371/journal.pone.0134959. eCollection 2015. PLoS One. 2015. PMID: 26263550 Free PMC article.
-
Skin healing and scale regeneration in fed and unfed sea bream, Sparus auratus.BMC Genomics. 2011 Oct 7;12:490. doi: 10.1186/1471-2164-12-490. BMC Genomics. 2011. PMID: 21981800 Free PMC article.
-
Identification and Characterization of the Very-Low-Density Lipoprotein Receptor Gene from Branchiostoma belcheri: Insights into the Origin and Evolution of the Low-Density Lipoprotein Receptor Gene Family.Animals (Basel). 2023 Jul 4;13(13):2193. doi: 10.3390/ani13132193. Animals (Basel). 2023. PMID: 37443991 Free PMC article.
References
-
- Wendelaar Bonga SE, Pang PK. Control of calcium regulating hormones in the vertebrates: parathyroid hormone, calcitonin, prolactin, and stanniocalcin. Int Rev Cytol. 1991;128:139–213. - PubMed
-
- Guerreiro PM, Fuentes J. In: Fish Osmoregulation. Baldisserotto B, Mancera Romero JM, Kapoor BG, editor. Enfield, USA: Science Publishers; 2007. Control of calcium balance in fish.
Publication types
MeSH terms
Substances
LinkOut - more resources
Full Text Sources
Molecular Biology Databases
Miscellaneous
