Comparative Study
. 2010 Aug 17:10:55.
doi: 10.1186/1471-2318-10-55.

Indicators of "healthy aging" in older women (65-69 years of age). A data-mining approach based on prediction of long-term survival

Affiliations
Comparative Study

Indicators of "healthy aging" in older women (65-69 years of age). A data-mining approach based on prediction of long-term survival

William R Swindell et al. BMC Geriatr. .

Abstract

Background: Prediction of long-term survival in healthy adults requires recognition of features that serve as early indicators of successful aging. The aims of this study were to identify predictors of long-term survival in older women and to develop a multivariable model based upon longitudinal data from the Study of Osteoporotic Fractures (SOF).

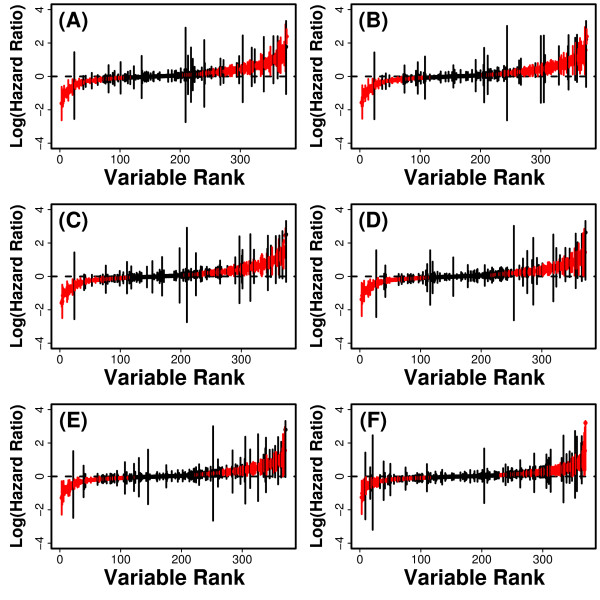
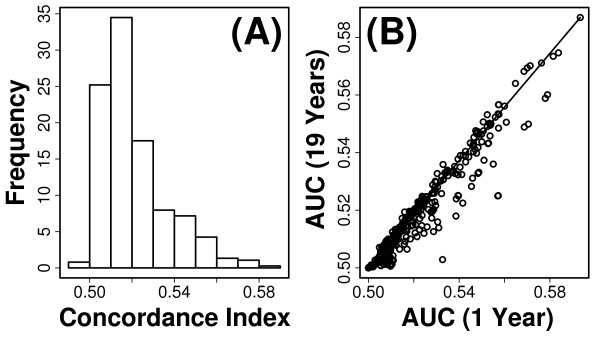
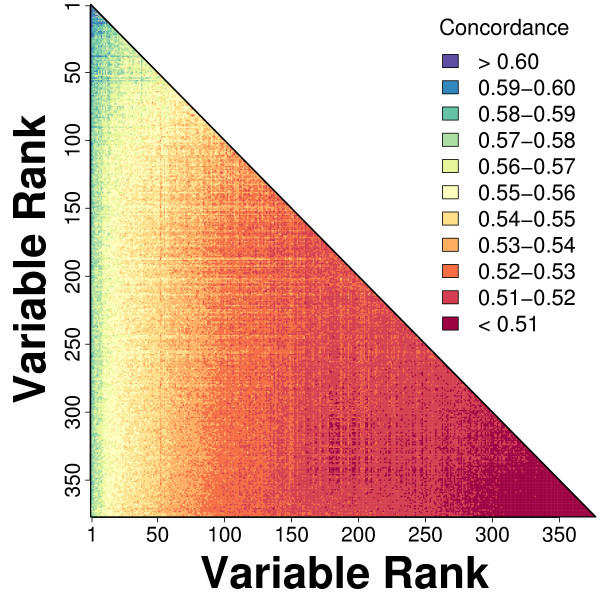
Methods: We considered only the youngest subjects (n = 4,097) enrolled in the SOF cohort (65 to 69 years of age) and excluded older SOF subjects more likely to exhibit a "frail" phenotype. A total of 377 phenotypic measures were screened to determine which were of most value for prediction of long-term (19-year) survival. Prognostic capacity of individual predictors, and combinations of predictors, was evaluated using a cross-validation criterion with prediction accuracy assessed according to time-specific AUC statistics.

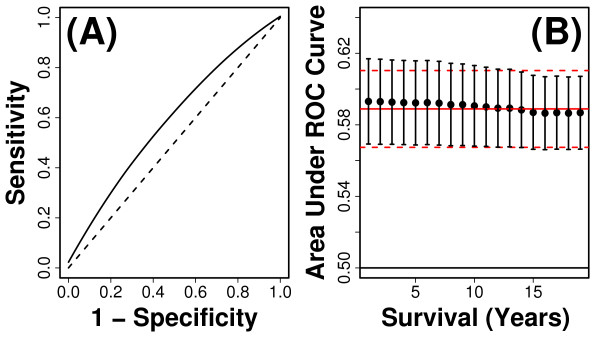
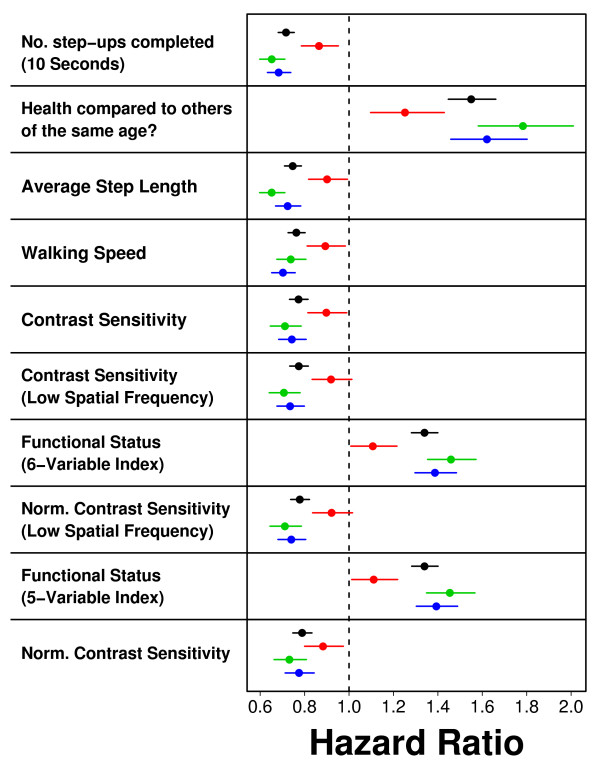
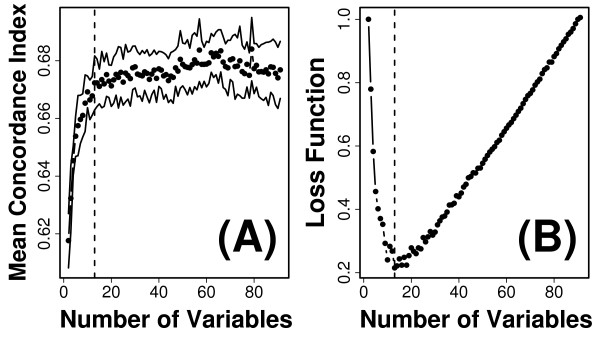
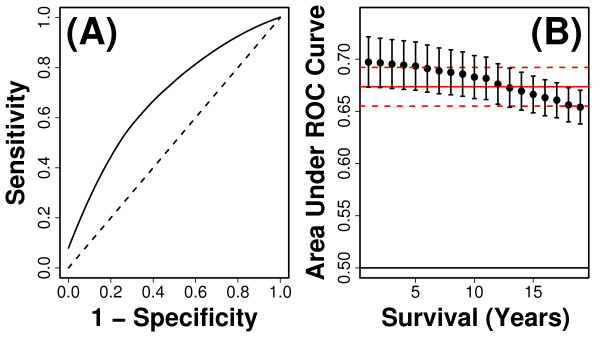
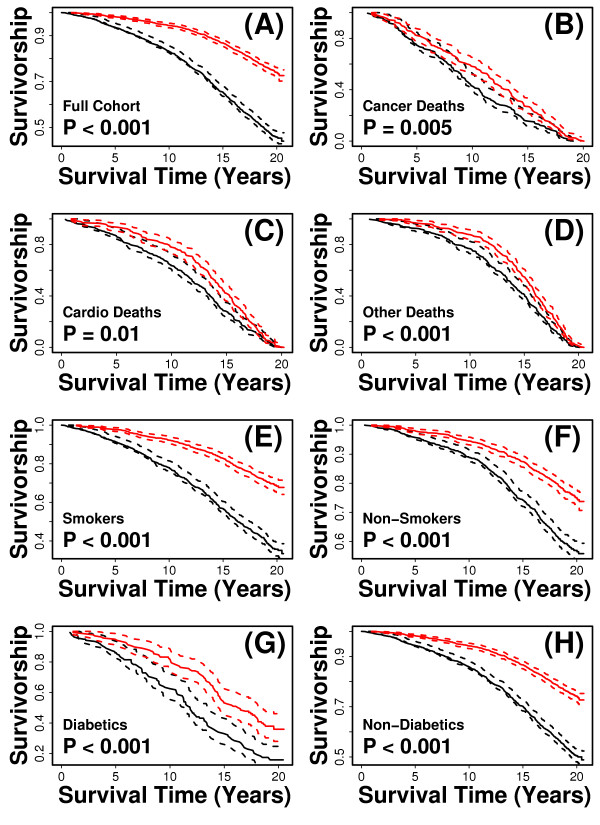
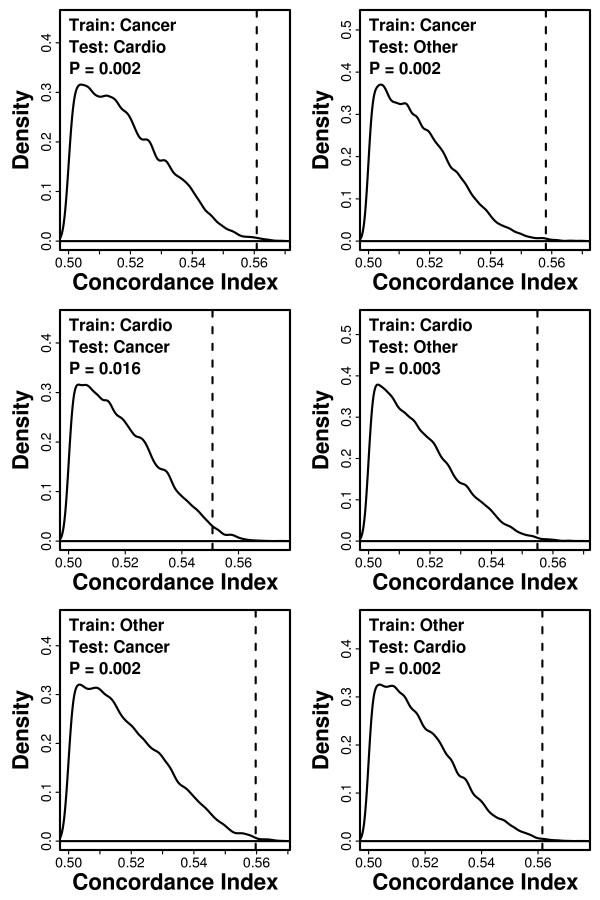
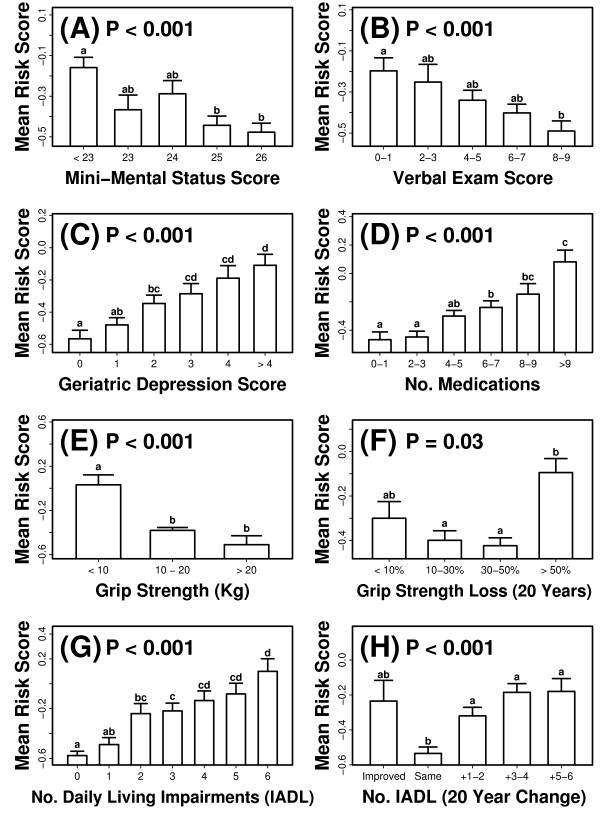
Results: Visual contrast sensitivity score was among the top 5 individual predictors relative to all 377 variables evaluated (mean AUC = 0.570). A 13-variable model with strong predictive performance was generated using a forward search strategy (mean AUC = 0.673). Variables within this model included a measure of physical function, smoking and diabetes status, self-reported health, contrast sensitivity, and functional status indices reflecting cumulative number of daily living impairments (HR >or= 0.879 or RH <or= 1.131; P < 0.001). We evaluated this model and show that it predicts long-term survival among subjects assigned differing causes of death (e.g., cancer, cardiovascular disease; P < 0.01). For an average follow-up time of 20 years, output from the model was associated with multiple outcomes among survivors, such as tests of cognitive function, geriatric depression, number of daily living impairments and grip strength (P < 0.03).

Conclusions: The multivariate model we developed characterizes a "healthy aging" phenotype based upon an integration of measures that together reflect multiple dimensions of an aging adult (65-69 years of age). Age-sensitive components of this model may be of value as biomarkers in human studies that evaluate anti-aging interventions. Our methodology could be applied to data from other longitudinal cohorts to generalize these findings, identify additional predictors of long-term survival, and to further develop the "healthy aging" concept.


Figures

Figure 1
Figure 1
Hazard ratios. Cox PH models were used to calculate the hazard ratio associated with each of the 377 predictor variables. In each plot, vertical lines represent 95% confidence intervals associated with log-transformed hazard ratios, with red lines indicating statistical significance of estimated ratios (P < 0.05). Lines representing confidence intervals are ordered with respect to a variable ranking based upon the hazard ratio point estimate obtained for each variable. In part (A), hazard ratios for each predictor variable were estimated using a univariate model without other covariate terms. In parts (B) - (F), hazard ratios were adjusted for one or more covariates. These covariates include (B) baseline age, (C) age and smoking history, (D) age, smoking and diabetes history, (E) age, smoking history, diabetes history and hypertension, and (F) age, smoking history, diabetes history, hypertension and self-rated health.
Figure 2
Figure 2
Cross-validation performance of univariate models. The predictive value of each variable was evaluated based upon 10,000 cross-validation trials. In each trial, a univariate Cox PH model was fit using a randomly chosen training dataset, and model performance was evaluated by applying the fitted model to subjects within a randomly chosen testing dataset. The predictive value of each variable was measured according to the average concordance index (C) among simulation trials (see Methods). The concordance index is an average of time-specific area under the curve statistics (i.e., AUC(t)), which were calculated for t = 1, ..., 19 years of follow-up time (see Methods). Part (A) shows the distribution of mean concordance estimates among all 377 predictor variables. In part (B), for each variable, the average value of AUC(19) among simulation trials is plotted against the average value of AUC(1).
Figure 3
Figure 3
Number of step-ups completed in 10 seconds. The number of step-ups completed in 10 seconds was the best single-variable predictor of short and long-term survival (mean C = 0.589). Part (A) shows the time-specific ROC curve corresponding to 10-years of follow-up time. Estimates of sensitivity and specificity were calculated as described in Methods and averaged among simulation trials. The dashed line corresponds to the null expectation with an AUC value of 0.50. Part (B) plots estimated values of AUC(t) across t = 1,..., 19 years of follow-up time. Each point represents the average value of AUC(t) among 10,000 simulation trials, and error bars indicate the standard deviation of AUC(t) among simulations. The solid red line indicates the mean concordance index of 0.589 among simulations, and dashed red lines represent one standard deviation above and below the mean concordance estimate.
Figure 4
Figure 4
Hazard ratio estimates associated with best predictor variables. The hazard ratio was estimated using single-variable Cox PH models for each of the best predictor variables listed in Table 1. Each point represents a hazard ratio estimate, and horizontal lines correspond to 95% confidence intervals associated with this estimated value. Black points correspond to hazard ratios estimated using data from all n = 4097 subjects. Hazard ratios were separately estimated based upon the n = 467 cancer deaths (red points), the n = 426 cardiovascular deaths (green points), and the n = 586 non-accidental/non-cancer/non-cardiovascular deaths (blue points). Cause-specific ratios were calculated by treating the n deaths assigned to a specific cause as non-censored, with censoring applied to deaths assigned to any other cause.
Figure 5
Figure 5
Performance of bivariate models. For each of 377C2 = 70876 possible combinations of the 377 predictor variables, we generated bivariate Cox PH models and evaluated the average concordance index (C) of each model across 20 cross-validation simulations. Colors represent the average concordance of a given model, with respect to the ranking of the two variables contained in a model. The variable rankings are based upon concordance estimates generated for each variable in univariate Cox PH models (i.e., values from Figure 2A), with low ranks assigned to variables of greatest predictive value.
Figure 6
Figure 6
Forward variable selection. The best bivariate model was based upon the number of step-ups completed by a subject in 10 seconds and whether a subject previously smoked (average C = 0.614). Variables were iteratively added to this model to evaluate concordance values associated with larger models. At each iteration, given a baseline model with p variables, the concordance associated with all possible models containing p + 1 variables was evaluated (based upon 20 cross-validation simulations). The best model containing p + 1 variables was chosen as a new baseline model and the process repeated. Points in part (A) show the mean concordance index associated with each of the models created by this process, and upper and lower lines indicate 95% confidence limits. (B) The size of a tentative model was chosen based upon the value of p that minimized a loss function. The point of diminishing returns with increasing p corresponds to a "knee" or leveling off point of the curve shown in part (A). To quantitatively locate this point, the scales shown in part (A) were mapped to the interval [0,1], and a loss function was defined as the distance between the plotted curve and the extreme upper-left corner of the coordinate system. The value of p that minimized this loss function is denoted by the dashed vertical lines in parts (A) and (B) (i.e., p = 13 variables).
Figure 7
Figure 7
Cross-validation performance of 13-variable index. The multivariate index we developed is based upon a model that includes 13 variables (see Table 2). The discrimination ability of risk scores generated from this model was evaluated based upon cross-validation methods and time-specific ROC curve metrics (e.g., see Figure 3). In each of 10,000 simulations, risk scores were calculated as linear predictors of Cox regression models that included the 13 variables listed in Table 2, with coefficients estimated using 3687 subjects randomly assigned to the testing set in each simulation, and prediction accuracy evaluated based upon discrimination ability of risk scores with respect to 410 subjects randomly assigned to the testing set in each simulation (see Methods). In part (A), the estimated time-specific ROC curve corresponding to 10-years follow-up time is shown. The dashed line corresponds to the null expectation with an AUC value of 0.50. Part (B) plots estimated values of AUC(t) across t = 1,..., 19 years of follow-up time. Each point represents the average value of AUC(t) among 10,000 simulation trials, and error bars indicate the standard deviation of AUC(t) among simulations. The solid red line indicates the mean concordance index of 0.671 among simulations, and dashed red lines represent one standard deviation above and below the mean concordance estimate.
Figure 8
Figure 8
The 13-variable index distinguishes between short and long-lived subjects with respect to multiple sub-cohorts. The index was used to assign a risk score to each subject using leave-one-out cross validation. In this method, a score is assigned to each of the n subjects, based upon a model fit to data from the other n - 1 subjects included in the dataset. After a score had been assigned to all subjects, the median score among all subjects was calculated. Subjects were assigned to a "low-risk group" if their score was below the median value, and were assigned to a "high-risk group" if their score was above the median value. The solid red line corresponds to the estimated Kaplan-Meier survival curve for the low-risk group, and the solid black line corresponds to the estimated curve for the high-risk group. Dotted red and black lines represent 95% confidence limits. In part (A), survival curves were generated from all n = 4097 subjects. In parts (B) - (H), the analysis was performed with respect to certain sub-populations of subjects. These sub-populations include (B) the n = 426 subjects dying of cancer, (C) the n = 467 subjects with cardiovascular-related deaths, (D) the n = 586 subjects with non-accidental deaths unrelated to cancer or cardiovascular disease, (E) the n = 1776 past or present smokers, (F) the n = 2316 non-smokers, (G) the n = 274 diabetic subjects, and (H) the n = 3823 non-diabetic subjects. P-values were generated from a log-rank test of the null hypothesis that low and high-risk groups have identical Kaplan-Meier survival curves [116].
Figure 9
Figure 9
Cross-validation by cause of death. Index coefficients were estimated based upon a training set of subjects that had died from one specific cause (cancer, cardiovascular, or non-cancer/non-cardiovascular). This generated a fitted model that was applied to a test set of subjects that had died from another specific cause, which differed from that of subjects in the training set. The discrimination ability of the model with respect to the survival times of subjects belonging to the test set was measured by estimating the concordance index (C). Train and test sets were either the n = 426 subjects that died of cancer, the n = 467 with cardiovascular-related deaths, or the n = 586 subjects with non-accidental deaths unrelated to cancer or cardiovascular disease. The dotted vertical line represents the estimated concordance index obtained for each cross-validation scenario. The density shown corresponds to a null distribution generated by 10,000 simulation trials. In these simulations, survival times in the training set were randomly permuted among subjects prior to estimation of model coefficients. The null distribution thus provides an indication of concordance values likely to arise by chance.
Figure 10
Figure 10
Risk scores generated from the 13-variable index are associated with multiple outcomes among subjects surviving the follow-up period (mean follow-up time: 20 years). Risk scores were calculated from baseline measures for all 4097 subjects and standardized to have a mean of zero and standard deviation of one. Outcome measures were available for n = 923 to 1296 subjects, and included (A) Mini-mental status exam score (0 - 26 point scale; n = 98 - 257 per group), (B) California Verbal Learning Test (10 minute delay, free recall; 0 - 9 point scale; n = 91 - 275 per group), (C) Geriatric depression score (0 - 15 point scale; n = 79 - 225 per group), (D) total number of prescription medications listed by each subject (n = 111 - 336 per group), (E) average of right and left hand grip strength (kg) (n = 79 - 763 per group), (F) change in average grip strength between the first and ninth visits (n = 79 - 389 per group), (G) reported number of impairments associated with daily living (n = 84 - 359 per group) and (H) the difference in reported number of daily living impairments between the first and ninth visits (n = 41 - 357 per group). The p-value listed in each panel was generated from an F-test of between-group differences in mean risk score (i.e., one way analysis of variance). Lowercase letters above each bar correspond to results from post hoc Tukey-Kramer comparisons, with significant differences between groups that do not share the same letter (P < 0.05).

Similar articles

Cited by

References

    1. Rowe JW, Kahn RL. Human aging: usual and successful. Science. 1987;237:143–49. doi: 10.1126/science.3299702. - DOI - PubMed
    1. Bowling A. Aspirations for older age in the 21st century: what is successful aging? Int J Aging Hum Dev. 2007;64:263–97. doi: 10.2190/L0K1-87W4-9R01-7127. - DOI - PubMed
    1. Nakasato YR, Carnes BA. Health promotion in older adults. Promoting successful aging in primary care settings. Geriatrics. 2006;61:27–31. - PubMed
    1. Butler RN, Sprott R, Warner H, Bland J, Feuers R, Forster M, Fillit H, Harman SM, Hewitt M, Hyman M, Johnson K, Kligman E, McClearn G, Nelson J, Richardson A, Sonntag W, Weindruch R, Wolf N. Biomarkers of aging: from primitive organisms to humans. J Gerontol A Biol Sci Med Sci. 2004;59:B560–7. - PubMed
    1. Simm A, Nass N, Bartling B, Hofmann B, Silber RE, Navarrete Santos A. Potential biomarkers of ageing. Biol Chem. 2008;389:257–65. doi: 10.1515/BC.2008.034. - DOI - PubMed

Publication types