

Longitudinally and circumferentially directed movements of the left ventricle studied by cardiovascular magnetic resonance phase contrast velocity mapping
- PMID: 20716369
- PMCID: PMC2929230
- DOI: 10.1186/1532-429X-12-48
Longitudinally and circumferentially directed movements of the left ventricle studied by cardiovascular magnetic resonance phase contrast velocity mapping
Abstract
Objective: Using high resolution cardiovascular magnetic resonance (CMR), we aimed to detect new details of left ventricular (LV) systolic and diastolic function, to explain the twisting and longitudinal movements of the left ventricle.
Methods: Using CMR phase contrast velocity mapping (also called Tissue Phase Mapping) regional wall motion patterns and longitudinally and circumferentially directed movements of the left ventricle were studied using a high temporal resolution technique in healthy male subjects (n = 14, age 23 +/- 3 years).
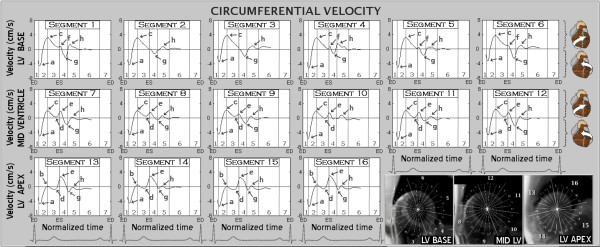
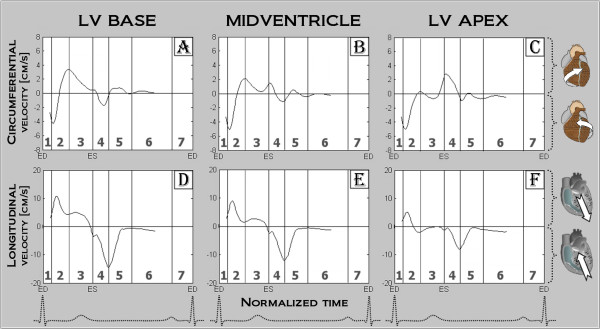
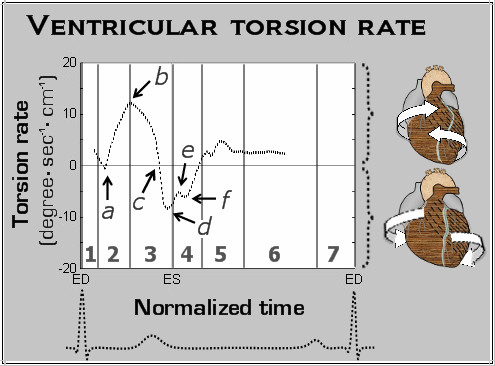
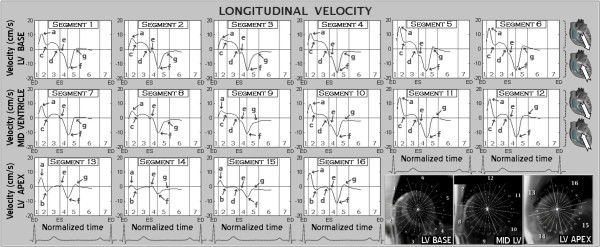
Results: Previously undescribed systolic and diastolic motion patterns were obtained for left ventricular segments (based on the AHA segmental) and for basal, mid and apical segments. The summation of segmental motion results in a complex pattern of ventricular twisting and longitudinal motion in the normal human heart which underlies systolic and diastolic function. As viewed from the apex, the entire LV initially rotates in a counter-clockwise direction at the beginning of ventricular systole, followed by opposing clockwise rotation of the base and counter-clockwise rotation at the apex, resulting in ventricular torsion. Simultaneously, as the entire LV moves in an apical direction during systole, the base and apex move towards each other, with little net apical displacement. The reverse of these motion patterns occur in diastole.
Conclusion: Left ventricular function may be a consequence of the relative orientations and moments of torque of the sub-epicardial relative to the sub-endocardial myocyte layers, with influence from tethering of the heart to adjacent structures and the directional forces associated with blood flow. Understanding the complex mechanics of the left ventricle is vital to enable these techniques to be used for the evaluation of cardiac pathology.
Figures
Similar articles
-
Details of left ventricular radial wall motion supporting the ventricular theory of the third heart sound obtained by cardiac MR.Br J Radiol. 2014 May;87(1037):20130780. doi: 10.1259/bjr.20130780. Epub 2014 Feb 24. Br J Radiol. 2014. PMID: 24641347 Free PMC article.
-
Details of left ventricular remodeling and the mechanism of paradoxical ventricular septal motion after coronary artery bypass graft surgery.J Invasive Cardiol. 2011 Jul;23(7):276-82. J Invasive Cardiol. 2011. PMID: 21725122
-
Myocardial tissue phase mapping with cine phase-contrast mr imaging: regional wall motion analysis in healthy volunteers.Radiology. 2006 Mar;238(3):816-26. doi: 10.1148/radiol.2383041992. Epub 2006 Jan 19. Radiology. 2006. PMID: 16424246
-
Assessment of systolic and diastolic LV function by MR myocardial tagging.Basic Res Cardiol. 1996;91 Suppl 2:23-8. doi: 10.1007/BF00795358. Basic Res Cardiol. 1996. PMID: 8957540 Review.
-
[Left ventricular rotation and twist of the heart. Clarification of some concepts].Orv Hetil. 2012 Sep 30;153(39):1547-51. doi: 10.1556/OH.2012.29465. Orv Hetil. 2012. PMID: 23000421 Review. Hungarian.
Cited by
-
CT-Based Analysis of Left Ventricular Hemodynamics Using Statistical Shape Modeling and Computational Fluid Dynamics.Front Cardiovasc Med. 2022 Jul 5;9:901902. doi: 10.3389/fcvm.2022.901902. eCollection 2022. Front Cardiovasc Med. 2022. PMID: 35865389 Free PMC article.
-
Details of left ventricular radial wall motion supporting the ventricular theory of the third heart sound obtained by cardiac MR.Br J Radiol. 2014 May;87(1037):20130780. doi: 10.1259/bjr.20130780. Epub 2014 Feb 24. Br J Radiol. 2014. PMID: 24641347 Free PMC article.
-
Effects of ventricular insertion sites on rotational motion of left ventricular segments studied by cardiac MR.Br J Radiol. 2013 Nov;86(1031):20130326. doi: 10.1259/bjr.20130326. Br J Radiol. 2013. PMID: 24133098 Free PMC article.
-
Acceleration of tissue phase mapping with sensitivity encoding at 3T.J Cardiovasc Magn Reson. 2011 Oct 12;13(1):59. doi: 10.1186/1532-429X-13-59. J Cardiovasc Magn Reson. 2011. PMID: 21992267 Free PMC article.
-
Ultrafast four-dimensional imaging of cardiac mechanical wave propagation with sparse optoacoustic sensing.Proc Natl Acad Sci U S A. 2021 Nov 9;118(45):e2103979118. doi: 10.1073/pnas.2103979118. Proc Natl Acad Sci U S A. 2021. PMID: 34732573 Free PMC article.
References
Publication types
MeSH terms
Grants and funding
LinkOut - more resources
Full Text Sources
Medical
Research Materials
Miscellaneous
