. 2010 Oct 15;285(42):32522-8.
doi: 10.1074/jbc.M110.155432. Epub 2010 Aug 17.

Metabolic depression and increased reactive oxygen species production by isolated mitochondria at moderately lower temperatures

Affiliations

Metabolic depression and increased reactive oxygen species production by isolated mitochondria at moderately lower temperatures

Sameh S Ali et al. J Biol Chem. .

Abstract

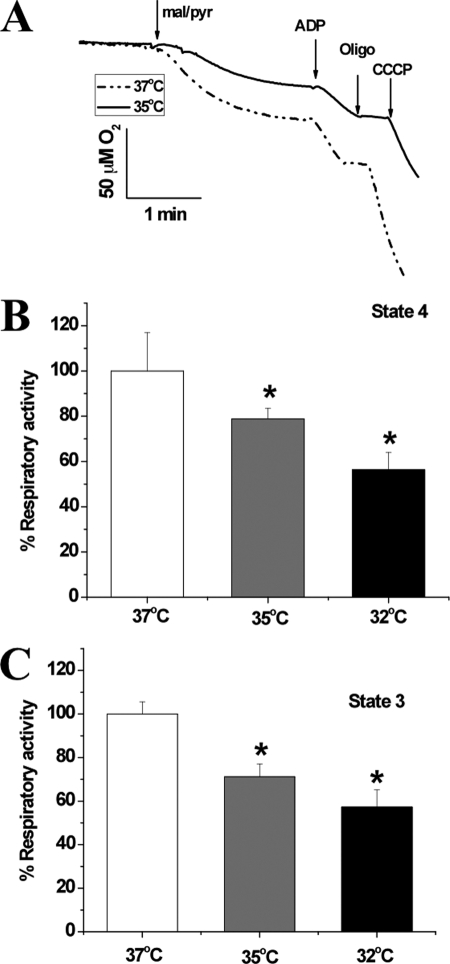
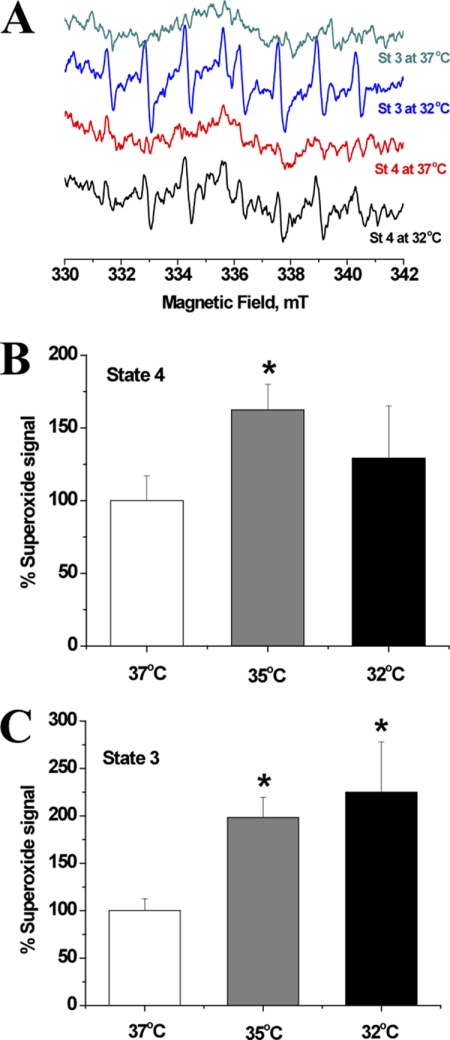
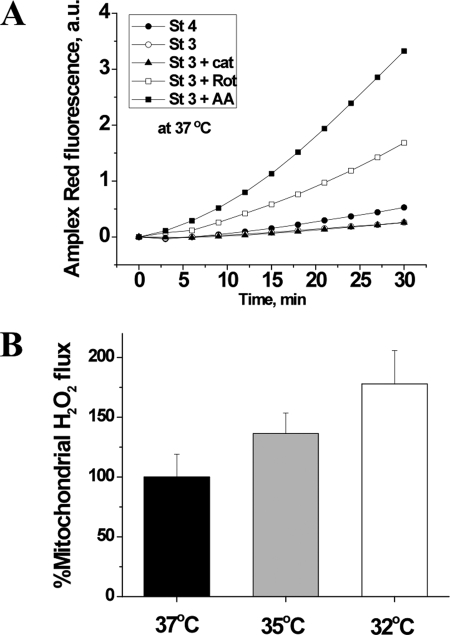
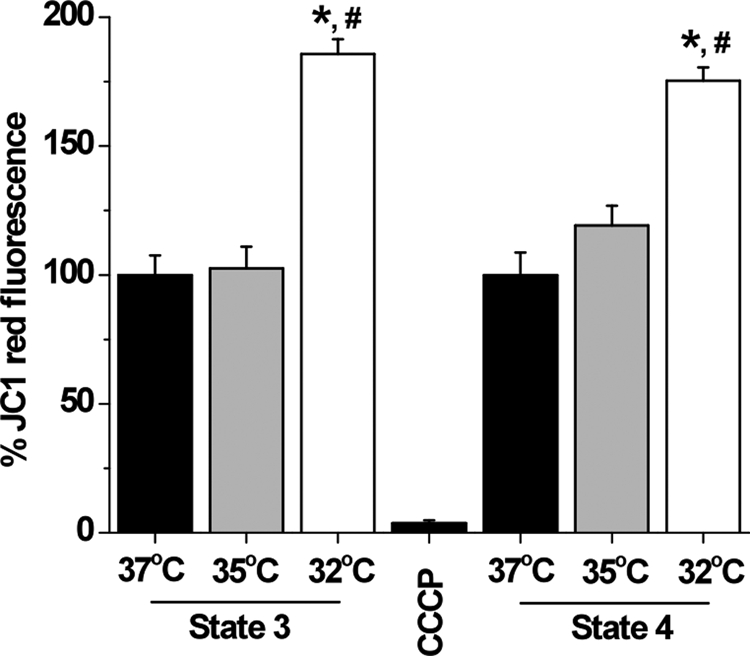
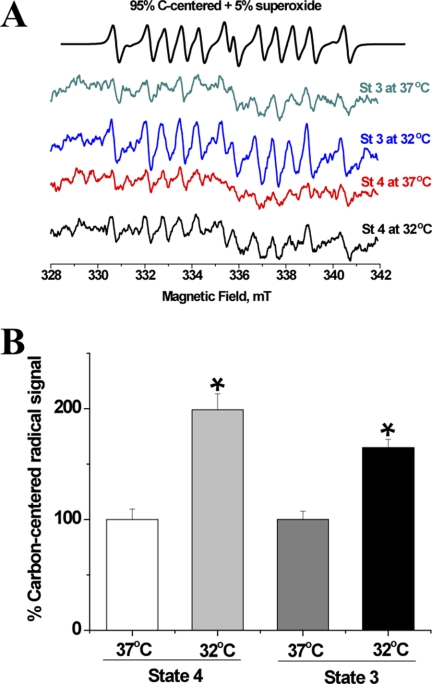
Temperature (T) reduction increases lifespan, but the mechanisms are not understood. Because reactive oxygen species (ROS) contribute to aging, we hypothesized that lowering T might decrease mitochondrial ROS production. We measured respiratory response and ROS production in isolated mitochondria at 32, 35, and 37 °C. Lowering T decreased the rates of resting (state 4) and phosphorylating (state 3) respiration phases. Surprisingly, this respiratory slowdown was associated with an increase of ROS production and hydrogen peroxide release and with elevation of the mitochondrial membrane potential, ΔΨ(m). We also found that at lower T mitochondria produced more carbon-centered lipid radicals, a species known to activate uncoupling proteins. These data indicate that reduced mitochondrial ROS production is not one of the mechanisms mediating lifespan extension at lower T. They suggest instead that increased ROS leakage may mediate mitochondrial responses to hypothermia.


Figures

FIGURE 1.
FIGURE 1.
Depression of mitochondrial metabolism at lower temperatures determined by polarographic measurements of oxygen consumption. Cortical mitochondria from 2–4-month-old C57BL/6 mice were isolated from PBS-perfused whole brain using Percoll gradient. A, representative oxygen consumption traces by mitochondria incubated at 37 °C (broken line) or 35 °C (solid line). Mitochondria (∼1–2 mg of protein) were added to the two oximetry chambers in a final volume 300-μl solution containing 100 mm KCl, 75 mm mannitol, 25 mm sucrose, 5 mm H3PO4, 0.05 mm EDTA, and 10 mm Tris-HCl, pH 7.4. BSA at 0.1% final concentration was included to eliminate free fatty acids and enhance mitochondria coupling. B and C, rates of oxygen consumptions during state 4 (B) or state 3 (C) by mitochondria freshly isolated from young mice brains. At 35 °C, significant reductions in both state 4 and state 3 are seen. Lowering the incubational temperature to 32 °C led to a further decrease in the rates of oxygen consumption during both respiratory states. Statistical significance was evaluated by a one-way ANOVA followed by Tukey's post hoc test. Differences in the means were considered statistically significant when *, p < 0.05; n = 5–8 independent runs/group.
FIGURE 2.
FIGURE 2.
Exposure of isolated brain mitochondria to slightly lower than physiologic temperature leads to increased superoxide leakage. Whole brain of 2–4-month-old C57BL/6 mouse was harvested before mitochondria were isolated as described under “Materials and Methods.” A, EPR spectra were acquired after mixing mitochondria with 70 mm DIPPMPO, the NAD+-linked substrates malate + pyruvate in the absence (state 4 respiration) or the presence of ADP (state 3 respiration). The mixture was incubated at the target temperature for 30 min and introduced into the EPR cavity that was maintained at the targeted temperature. B and C, quantification of EPR signals at targeted temperatures during state 4 (B) or state 3 (C) respiration was carried out for five to eight independent runs/condition, and the results are shown as mean ± S.E. (error bars). *, p < 0.05.
FIGURE 3.
FIGURE 3.
Hydrogen peroxide generation in phosphorylating mitochondria is greater at lower temperatures. A, hydrogen peroxide release by mitochondria incubated with various substrates, inhibitors, and/or enzymes at various temperatures was detected using Amplex Red and horseradish peroxidase. Fluorescence readings were taken at 3-min intervals for up to 30 min, and the rates of fluorescence increase were calculated for each kinetic curve. a.u., arbitrary units. B, means ± S.E. (error bars) of three or four independent runs are given. Rotenone (Rot, complex I inhibitor, 2.4 μm), and antimycin A (AA, complex III inhibitor, 10 μm) dramatically increased H2O2 release during state 3, but this increase was not temperature-dependent (data not shown). Catalase (cat, 100 units/ml) eliminated the H2O2 signal.
FIGURE 4.
FIGURE 4.
Cold-induced hyperpolarization of mitochondrial membrane potential. Fluorescence measurements of changes in mitochondrial membrane potential are probed by following JC-1 red fluorescence due to JC-1 aggregation in mitochondria. Addition of the uncoupler control carbonyl cyanide m-chlorophenylhydrazone (CCCP; 1 μm) rapidly depolarized the mitochondrial potential. Phosphorylating and resting mitochondria incubated at lower temperatures exhibited hyperpolarized membrane potential that reached statistical significance at 32 °C; *, p < 0.05 compared with state 3 at 37 °C; #, p < 0.05 compared with state 4 at 37 °C, n = 3 per group.
FIGURE 5.
FIGURE 5.
Cold increases the production of lipid-derived carbon-centered radicals in brain mitochondria. A, EPR spectra acquired after a 30-min incubation of mitochondria (0.2–0.4 mg of protein) at 32 °C or 37 °C, with 70 mm DEPMPO during state 4 or state 3 respirations. The top trace is a computer-generated spectrum of 95% carbon-centered radical + 5% superoxide radical using the following hyperfine splitting constants: DEPMPO-OOH, ap = 50 G, aN = 13.11 G, aH = 11.05 G; aH = 0.9 G; aH = 0.60 G; aH(2) = 0.44 G; aH(3) = 0.38 G; DEPMPO/CCR, ap = 48.1 G, aN = 15.0 G, aH = 22.3 G. B, quantification of the EPR signals of the adduct between DEPMPO and a lipid-derived CCR (mean ± S.E. (error bars)). One-way ANOVA indicated that mitochondria incubated at 32 °C produced significantly greater CCRs than those incubated at 37 °C both during state 3 and state 4, n = 4 per condition.

Similar articles

Cited by

References

    1. D'Autréaux B., Toledano M. B. (2007) Nat. Rev. Mol. Cell Biol. 8, 813–824 - PubMed
    1. Wallace D. C., Fan W. (2009) Genes Dev. 23, 1714–1736 - PMC - PubMed
    1. Wallace D. C. (2005) Annu. Rev. Genet. 39, 359–407 - PMC - PubMed
    1. Harman D. (1992) Mutat. Res. 275, 257–266 - PubMed
    1. Sohal R. S., Mockett R. J., Orr W. C. (2002) Free Radic. Biol. Med. 33, 575–586 - PubMed

Publication types

Substances

LinkOut - more resources