. 2010 Oct 22;285(43):32869-32877.
doi: 10.1074/jbc.M110.135509. Epub 2010 Aug 16.

Adipose tissue-specific inhibition of hypoxia-inducible factor 1{alpha} induces obesity and glucose intolerance by impeding energy expenditure in mice

Affiliations

Adipose tissue-specific inhibition of hypoxia-inducible factor 1{alpha} induces obesity and glucose intolerance by impeding energy expenditure in mice

Xinmei Zhang et al. J Biol Chem. .

Abstract

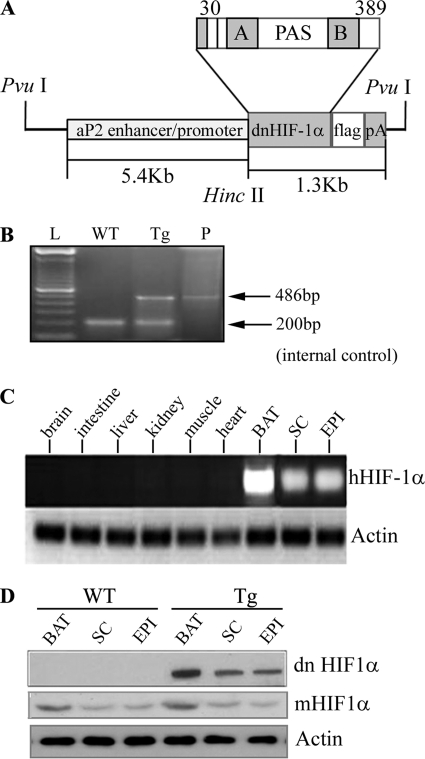
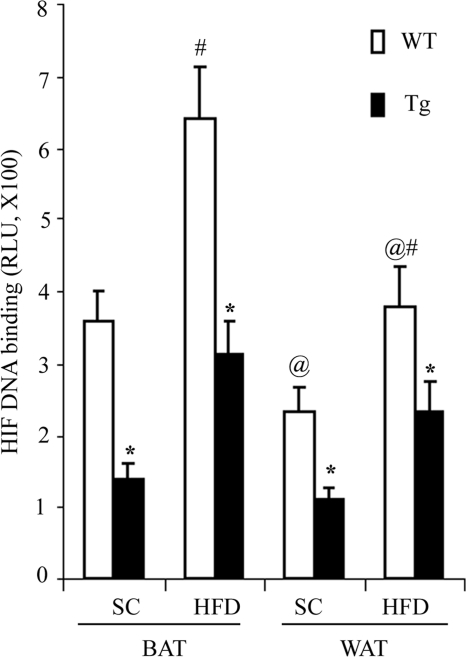
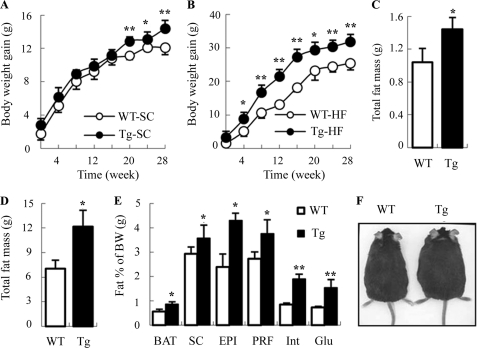
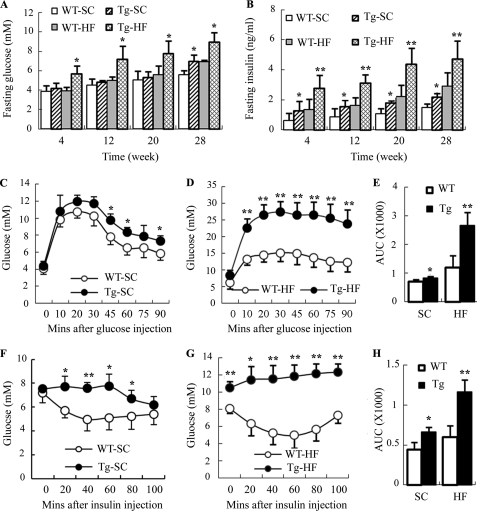
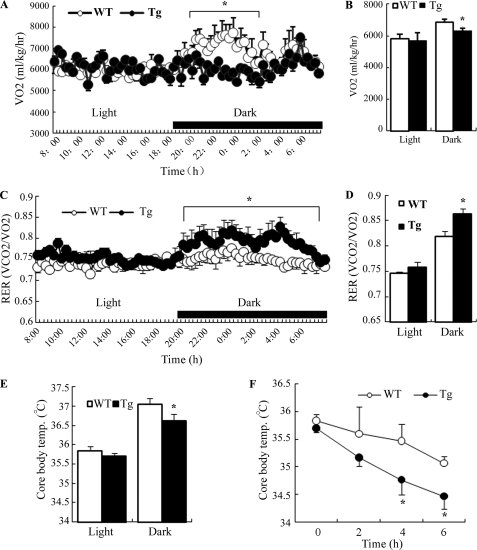
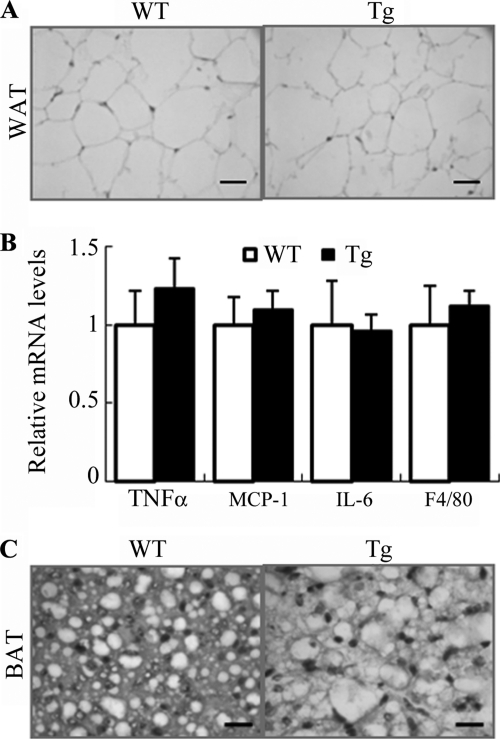
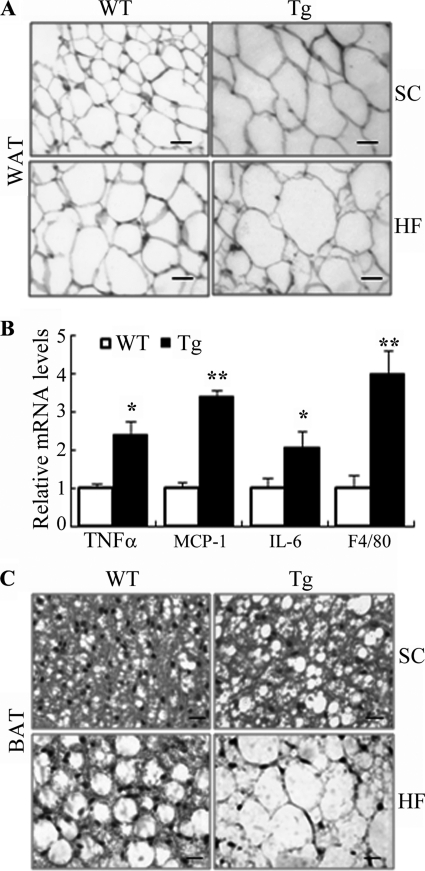
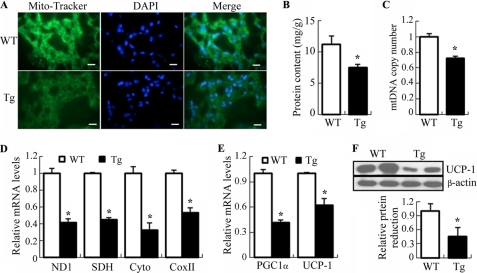
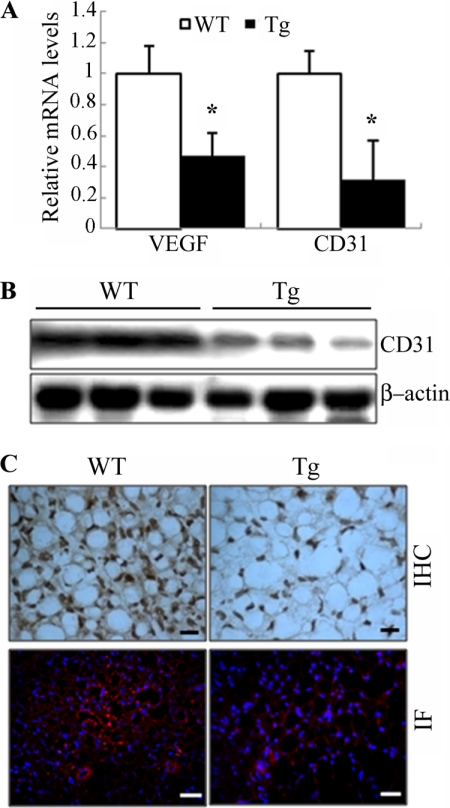
Hypoxia in adipose tissue has been postulated as a possible contributor to obesity-related chronic inflammation, insulin resistance, and metabolic dysfunction. HIF1α (hypoxia-inducible factor 1α), a master signal mediator of hypoxia response, is elevated in obese adipose tissue. However, the role of HIF1α in obesity-related pathologies remains to be determined. Here we show that transgenic mice with adipose tissue-selective expression of a dominant negative version of HIF1α developed more severe obesity and were more susceptible to high fat diet-induced glucose intolerance and insulin resistance compared with their wild type littermates. Obesity in the transgenic mice was attributed to impaired energy expenditure and reduced thermogenesis. Histological examination of interscapular brown adipose tissue (BAT) in the transgenic mice demonstrated a markedly increased size of lipid droplets and decreased mitochondrial density in adipocytes, a phenotype similar to that in white adipose tissue. These changes in BAT of the transgenic mice were accompanied by decreased mitochondrial biogenesis and reduced expression of key thermogenic genes. In the transgenic mice, angiogenesis in BAT was decreased but was little affected in white adipose tissue. These findings support an indispensable role of HIF1α in maintaining the thermogenic functions of BAT, possibly through promoting angiogenesis and mitochondrial biogenesis in this tissue.


Figures

FIGURE 1.
FIGURE 1.
Generation of transgenic mice with adipose tissue-selective expression of dominant negative HIF1α. A, schematic representation of the transgenic construct. Shown is cDNA encoding a dn version of human HIF1α driven by a 5.4-kb aP2 promoter/enhancer. PAS, Per-ARNT-Sim. A and B, PAS-A and PAS-B domains. B, confirmation of the presence of the dn Hif1α transgene by PCR analysis in transgenic mice. A 486-bp DNA fragment spanning from the aP2 promoter to dn HIF1α gene was amplified by PCR. WT, wild type littermate; Tg, transgene-positive; P, plasmid DNA-positive control. C, RT-PCR analysis to confirm adipose tissue-selective expression of dn HIF1α in transgenic mice. Total RNA was extracted from various tissues of the transgenic mice (10 weeks old). Mouse actin was used as an internal control. SC, subcutaneous fat; EPI, epididymal fat. D, Western blot analysis to measure the protein abundance of dn HIF1α using anti-FLAG antibody and mouse endogenous HIF1α (mHIF1α) using anti-HIF1α monoclonal antibody. 40 μg of protein was loaded in each lane.
FIGURE 2.
FIGURE 2.
Transgenic expression of dn HIF1α inhibits the DNA binding activity levels of the transcription factor in both BAT and WAT. The aP2/dn HIF1α transgenic mice and wild type littermates fed a standard chow (SC) and HFD for 8 weeks. Nuclear extract proteins isolated from interscapular BAT and epididymal WAT were subjected to an HIF filter plate assay to determine the DNA binding activity levels to the hypoxia response element as described under “Experimental Procedures.” RLU, relative light units. *, p < 0.05 versus wild type littermates; #, p < 0.05 versus the corresponding SC group; @, p < 0.05 versus the BAT group, n = 5 in each group. Error bars, S.E.
FIGURE 3.
FIGURE 3.
Transgenic mice with adipose tissue-selective expression of dn HIF1α display increased body weight and expanded fat mass. Age-dependent changes in body weight gain in aP2/dn HIF1α transgenic mice and wild type littermates fed a standard chow (A) and HFD (B) were monitored on a weekly basis. Total fat mass of the mice fed a standard chow (C) and high fat diet (D) was analyzed at the time of dissection (32 weeks after birth). E, percentage of BAT and WAT at various anatomical locations over total body weight in the transgenic mice and wild type littermates fed an HFD. SC, subcutaneous fat; EPI, epididymal fat; PRF, peri-renal fat; Int, interscapular white fat; Glu, gluteal fat. F, representative transgenic mouse and a wild type littermate fed an HFD for 28 weeks. *, p < 0.05; **, p < 0.01 versus WT littermates (n = 5–9). A and B were analyzed by analysis of variance. C–E were analyzed by Student's t test. Error bars, S.E.
FIGURE 4.
FIGURE 4.
Transgenic expression of dn HIF1α in adipose tissue aggravates HFD-induced hyperglycemia and hyperinsulinemia and impairs glucose tolerance and insulin sensitivity in mice. Fasting levels of blood glucose (A) and serum insulin (B) were measured every 4 weeks in aP2/dn HIF1α transgenic mice and wild type littermates on either a standard chow or HFD. An intraperitoneal glucose tolerance test (C–E) and insulin tolerance test (F–H) were conducted at 28 weeks after feeding standard chow or HFD, respectively. WT-SC, wild type mice fed standard chow; Tg-SC, transgenic mice fed standard chow; WT-HF, wild type mice fed HFD; Tg-HF, transgenic mice fed a high fat diet. *, p < 0.05; **, p < 0.01 versus wild type littermates (n = 5–9). Error bars, S.E.
FIGURE 5.
FIGURE 5.
Transgenic expression of dn HIF1α in adipose tissue reduces energy expenditure, lipid utilization, and thermogenesis in mice. Indirect calorimetry was performed by housing 28-week-old aP2/dn HIF1α transgenic mice and wild type littermates under a high fat diet in a six-chamber Oxymax Lab Animal Monitoring System. A, VO2 during a 24-h light and dark cycle. B, oxygen consumption expressed as area under curve. C, RER (VCO2/VO2) during the 24-h light and dark cycle. D, RER expressed as area under curve. E, average core body temperature measured during 24-h light and dark cycle. F, changes in core body temperature when exposed to cold temperature. *, p < 0.05 versus WT littermates by Student's t test (n = 5–6). Error bars, S.E.
FIGURE 6.
FIGURE 6.
Changes in adipocyte size and expression of proinflammation markers in adipose tissue of 4-week-old aP2/dn Hif1α transgenic mice. A, representative microscopic images for histological sections of epididymal fat pads from 4-week-old transgenic mice and wild type controls. Scale bar, 10 μm. B, relative mRNA abundance of several inflammation markers in epididylmal fat as determined by real time PCR (n = 5). C, representative macroscopic photos for histological sections of BAT from 4-week-old transgenic mice and wild type controls. Scale bar, 10 μm. Error bars, S.E.
FIGURE 7.
FIGURE 7.
Increased adipocyte sizes and elevated inflammation in adipose tissue of 32-week-old aP2/dn Hif1α transgenic mice on standard chow. A, representative microscopic images from histological sections of epididymal fat pads stained with hematoxylin and eosin. SC, standard chow; HF, high fat diet. Scale bar, 10 μm. B, real time PCR analysis to quantify the mRNA expression levels for several proinflammatory markers in epididymal fat pads under high fat diet. The relative abundance of each gene was normalized against 18 S RNA and expressed as -fold over wild type littermates (n = 5–9). *, p < 0.05; **, p < 0.01 versus WT controls. C, typical microscopic photos from histological sections of BAT. Scale bar, 10 μm. Error bars, S.E.
FIGURE 8.
FIGURE 8.
Decreased mitochondrial contents and reduced mitochondrial biogenesis in BAT of 32-week-old aP2/dn Hif1α transgenic mice. A, frozen sections of BAT stained with Mito-Tracker (green) and DAPI (blue). Tg, aP2/dn HIF1α transgenic mice; WT, wild type littermates. Scale bar, 10 μm. B, mitochondrial protein contents expressed as mg of the isolated mitochondria/g of BAT. C, mtDNA copy number expressed as -fold over wild type littermates after normalization against the nuclear gene T-cell receptor. D, real-time PCR analysis to quantify the relative mRNA abundance of several genes involved in mitochondrial biogenesis in BAT. ND1, NADH dehydrogenase subunit 1; SDH, succinate dehydrogenase; Cyto, cytochrome b; COX II, cytochrome c oxidase subunit 1. E, relative mRNA abundance of Pgc1α and Ucp-1 as determined by real time PCR. F, Western blot analysis to determine the protein levels of UCP-1. 30 μg of protein from total BAT lysates were loaded in each lane. *, p < 0.05; **, p < 0.01 versus wild type littermates (n = 5–9). Error bars, S.E.
FIGURE 9.
FIGURE 9.
Decreased angiogenesis in BAT of 4-week-old aP2/dn Hif1α transgenic mice. A, relative mRNA levels of VEGF and CD31 in BAT of the transgenic mice and their wild type littermates as determined by quantitative RT-PCR (n = 5–6). B, Western blot analysis to determine the protein levels of CD31 in BAT. 50 μg of protein from total cell lysates was loaded in each lane. C, representative images from histological sections of BAT stained with the endothelial marker CD31. The nuclei in the lower panel were stained with DAPI (blue). Scale bar, 10 μm. IHC, immunohistochemistry; IF, immunofluorescence. Error bars, S.E.

Similar articles

Cited by

References

    1. Rajala M. W., Scherer P. E. (2003) Endocrinology 144, 3765–3773 - PubMed
    1. Wellen K. E., Hotamisligil G. S. (2005) J. Clin. Invest. 115, 1111–1119 - PMC - PubMed
    1. Weisberg S. P., McCann D., Desai M., Rosenbaum M., Leibel R. L., Ferrante A. W., Jr. (2003) J. Clin. Invest. 112, 1796–1808 - PMC - PubMed
    1. Xu H., Barnes G. T., Yang Q., Tan G., Yang D., Chou C. J., Sole J., Nichols A., Ross J. S., Tartaglia L. A., Chen H. (2003) J. Clin. Invest. 112, 1821–1830 - PMC - PubMed
    1. Trayhurn P., Wang B., Wood I. S. (2008) Br. J. Nutr. 100, 227–235 - PubMed

Publication types

MeSH terms