. 2011 Mar-Apr;17(2):272-90.
doi: 10.1093/humupd/dmq036. Epub 2010 Aug 17.

Dynamic changes in gene expression during human early embryo development: from fundamental aspects to clinical applications

Affiliations

Dynamic changes in gene expression during human early embryo development: from fundamental aspects to clinical applications

Said Assou et al. Hum Reprod Update. 2011 Mar-Apr.

Abstract

Background: The first week of human embryonic development comprises a series of events that change highly specialized germ cells into undifferentiated human embryonic stem cells (hESCs) that display an extraordinarily broad developmental potential. The understanding of these events is crucial to the improvement of the success rate of in vitro fertilization. With the emergence of new technologies such as Omics, the gene expression profiling of human oocytes, embryos and hESCs has been performed and generated a flood of data related to the molecular signature of early embryo development.

Methods: In order to understand the complex genetic network that controls the first week of embryo development, we performed a systematic review and study of this issue. We performed a literature search using PubMed and EMBASE to identify all relevant studies published as original articles in English up to March 2010 (n = 165). We also analyzed the transcriptome of human oocytes, embryos and hESCs.

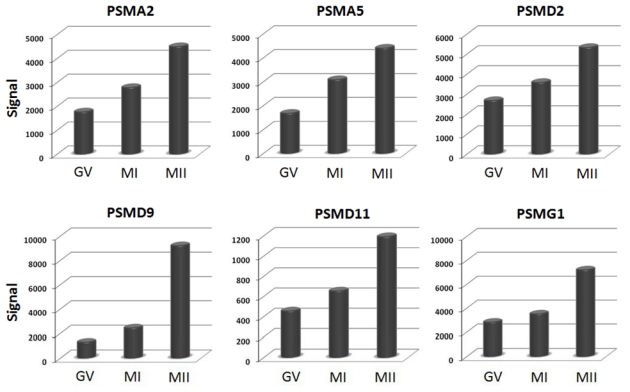
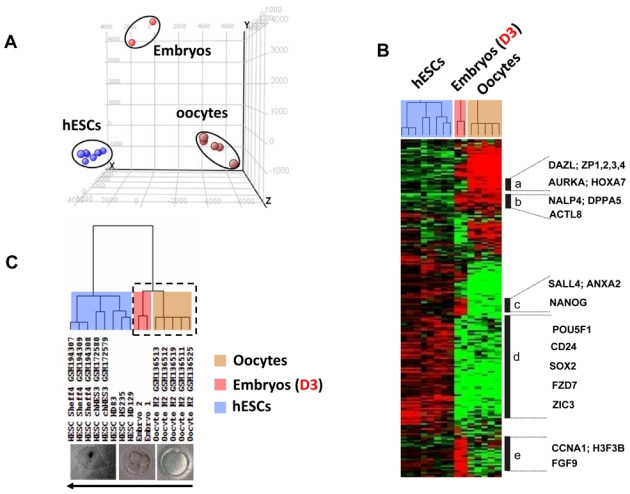
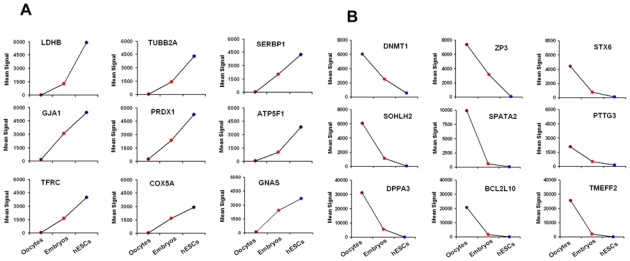
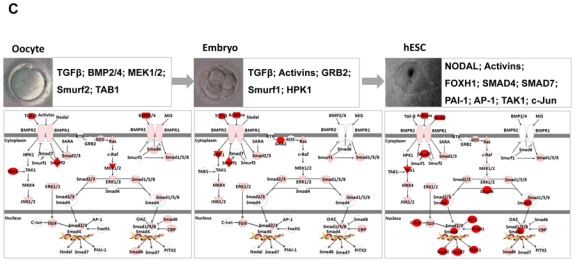
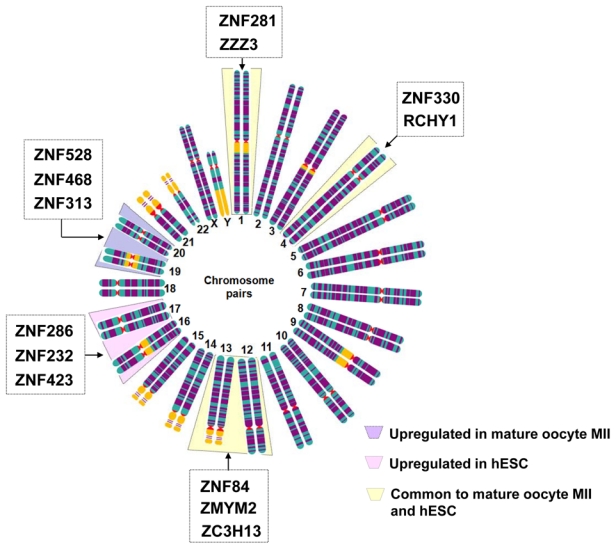
Results: Distinct sets of genes were revealed by comparing the expression profiles of oocytes, embryos on Day 3 and hESCs, which are associated with totipotency, pluripotency and reprogramming properties, respectively. Known components of two signaling pathways (WNT and transforming growth factor-β) were linked to oocyte maturation and early embryonic development.

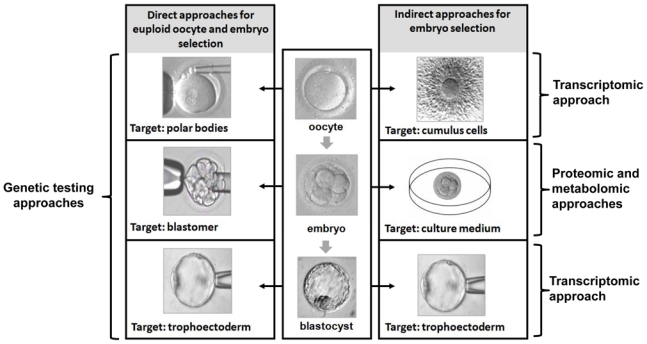
Conclusions: Omics analysis provides tools for understanding the molecular mechanisms and signaling pathways controlling early embryonic development. Furthermore, we discuss the clinical relevance of using a non-invasive molecular approach to embryo selection for the single-embryo transfer program.


Figures

Figure 1
Figure 1
Upregulation of proteasome genes during oocyte maturation. Histograms show signal values of six proteasome genes (PSMA2, PSMA5, PSMD2, PSMD9, PSMD11 and PSMG1) in each stage of oocyte maturation. Gene expression is measured by pan-genomic HG-U133 Plus 2.0 Affymetrix oligonucleotides microarrays, and the signal intensity for each gene is shown on the Y-axis as arbitrary units determined by the GCOS 1.2 software (Affymetrix). GV; germinal vesicle; MI, metaphase I; MII, metaphase II.
Figure 2
Figure 2
Principal component analysis (PCA) and hierarchical clustering of all samples from different developmental stages. (A) PCA distributes samples into a three-dimensional space based on the variances in gene expression; samples that have similar trends in their gene expression profiles will cluster together in the PCA plot. This analysis, using GeneSpring® software, resulted in a clear segregation of the fifteen replicated samples into three clusters, corresponding to human mature oocytes, human embryos, and hESCs. Each colored point represents a sample, characterized by the gene expression of all probe sets (54,675) on the Affymetrix HG U133 Plus 2 array. The first, second, and third principal components are displayed on the X-, Y- and Z-axes, respectively. (B) The expression signatures of samples were visualized by hierarchical clustering on the 10,000 probe sets with the highest variation coefficient. The colors indicate the relative expression levels of each gene, with red indicating an expression above median, green indicating expression under median and black representing median expression. Cluster (a) was a group of genes differentially overexpressed in oocytes, including DAZL, ZP1, ZP2, ZP3, ZP4, AURKA and HOXA7. Cluster (b) featured genes that were detected in both oocyte and embryo samples, such as the NALP4, DPPA5, and ACTL8. Cluster (c) grouped genes that were detected in both embryo and hESC samples, such as NANOG, SALL4, and ANXA2. Cluster (d) included genes differentially overexpressed in hESCs, such as POU5F1, CD24, SOX2, FZD7 and ZIC3. Cluster (e) assembled genes overexpressed in day-3 embryos, such as CCNA1, H3F3B and FGF9. (C) The dendogram shows that all replicates are clustered by their appropriate stage. All the replicate samples of the hESC group self-cluster into one branch. Both oocyte and embryo samples self-cluster into another branch (dotted box) that further divides into two major sub-branches and into which all the replicates from oocytes and embryos self-cluster.
Figure 3
Figure 3
Expression of selected genes in human oocytes, and embryos on day-3 and hESCs. Figure show signal values of 18 genes that are gradually increased (A) or decreased (B) during early embryonic development. (C) Characterization of TGF-β signalling pathway during early embryonic development. Genes shown in red are upregulated in human oocytes or in embryos on day-3 or in hESCs. Examples of genes overexpressed (red) in each stage are indicated in boxes.
Figure 3
Figure 3
Expression of selected genes in human oocytes, and embryos on day-3 and hESCs. Figure show signal values of 18 genes that are gradually increased (A) or decreased (B) during early embryonic development. (C) Characterization of TGF-β signalling pathway during early embryonic development. Genes shown in red are upregulated in human oocytes or in embryos on day-3 or in hESCs. Examples of genes overexpressed (red) in each stage are indicated in boxes.
Figure 4
Figure 4
Chromosomal distribution of genes encoding zinc finger domain proteins were expressed significantly differently in human mature oocytes (light violet) as compared to hESCs (light pink) as well as to those commonly expressed in mature human oocytes and hESCs (light yellow). The selected genes were retrieved in lists previously published in (Assou et al., 2009).
Figure 5
Figure 5
Different direct or indirect approaches suggested for oocyte or embryo selection (transcriptomic, proteomic and metabolomic approaches).

Similar articles

Cited by

References

    1. Abeyta MJ, Clark AT, Rodriguez RT, Bodnar MS, Pera RA, Firpo MT. Unique gene expression signatures of independently-derived human embryonic stem cell lines. Hum Mol Genet. 2004;13:601–8. - PubMed
    1. Adjaye J, Bolton V, Monk M. Developmental expression of specific genes detected in high-quality cDNA libraries from single human preimplantation embryos. Gene. 1999;237:373–83. - PubMed
    1. Adjaye J, Huntriss J, Herwig R, BenKahla A, Brink TC, Wierling C, Hultschig C, Groth D, Yaspo ML, Picton HM, et al. Primary differentiation in the human blastocyst: comparative molecular portraits of inner cell mass and trophectoderm cells. Stem Cells. 2005;23:1514–25. - PubMed
    1. Adriaenssens T, Wathlet S, Segers I, Verheyen G, De Vos A, Van der Elst J, Coucke W, Devroey P, Smitz J. Cumulus cell gene expression is associated with oocyte developmental quality and influenced by patient and treatment characteristics. Hum Reprod. 2010;25:1259–70. - PubMed
    1. Andersen AN, Goossens V, Gianaroli L, Felberbaum R, de Mouzon J, Nygren KG. Assisted reproductive technology in Europe, 2003. Results generated from European registers by ESHRE. Hum Reprod. 2007;22:1513–25. - PubMed

Publication types