

Low-carbohydrate diets and prostate cancer: how low is "low enough"?
- PMID: 20716631
- PMCID: PMC3757152
- DOI: 10.1158/1940-6207.CAPR-10-0071
Low-carbohydrate diets and prostate cancer: how low is "low enough"?
Abstract
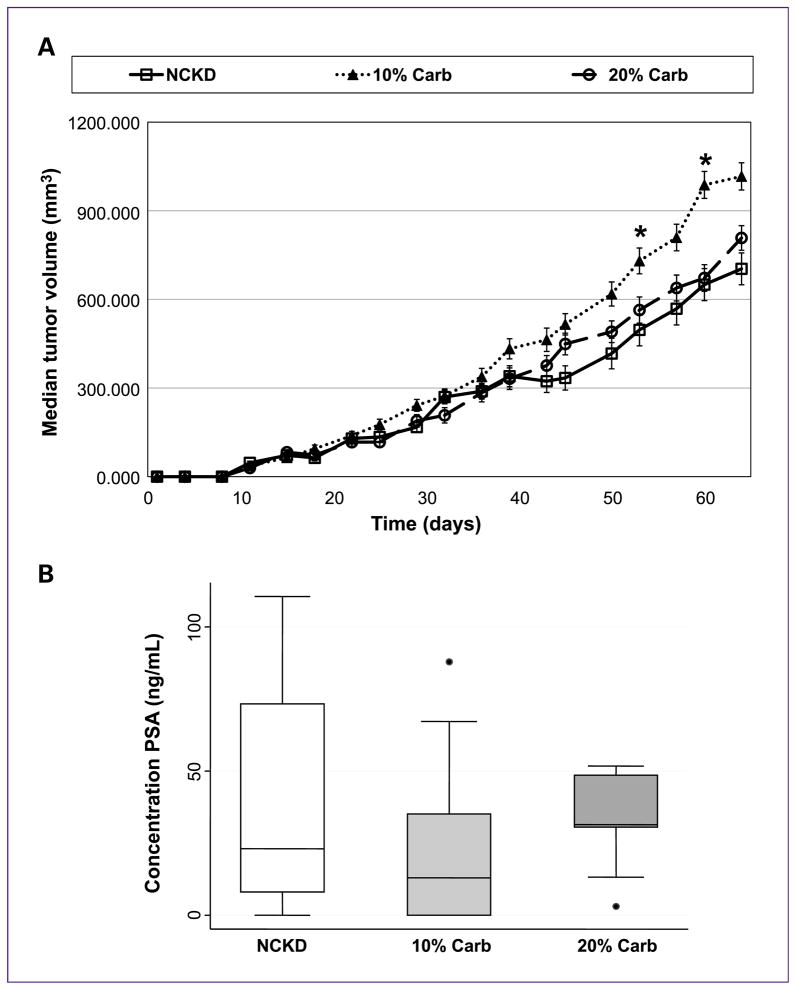
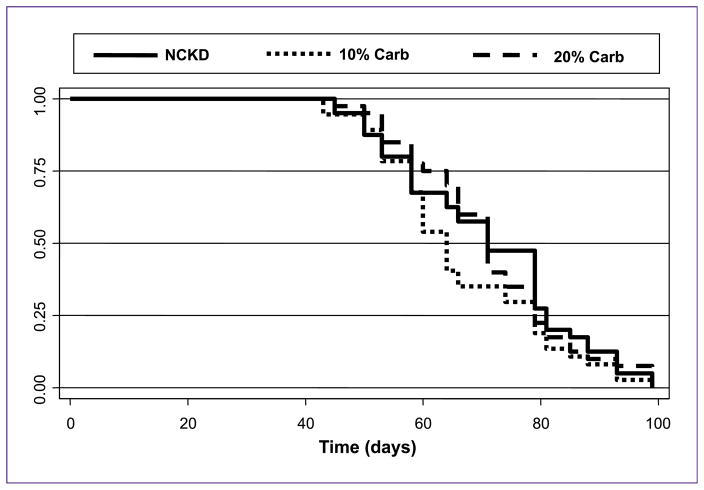
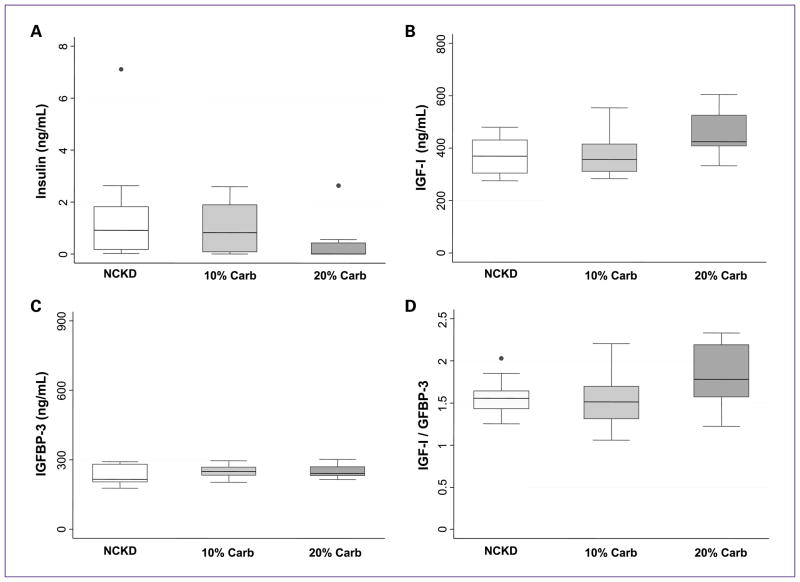
Previous studies indicate that carbohydrate intake influences prostate cancer biology, as mice fed a no-carbohydrate ketogenic diet (NCKD) had significantly smaller xenograft tumors and longer survival than mice fed a Western diet. As it is nearly impossible for humans to consume and maintain NCKD, we determined whether diets containing 10% or 20% carbohydrate kcal showed similar tumor growth as NCKD. A total of 150 male severe combined immunodeficient mice were fed a Western diet ad libitum, injected with the human prostate cancer cell line LAPC-4, and then randomized 2 weeks later to one of three arms: NCKD, 10% carbohydrate, or 20% carbohydrate diets. Ten mice not injected were fed an ad libitum low-fat diet (12% fat kcal) serving as the reference in a modified-paired feeding protocol. Mice were sacrificed when tumors reached 1,000 mm(3). Despite consuming extra calories, all mice receiving low-carbohydrate diets were significantly lighter than those receiving a low-fat diet (P < 0.04). Among the low-carbohydrate arms, NCKD-fed mice were significantly lighter than the 10% or 20% carbohydrate groups (P < 0.05). Tumors were significantly larger in the 10% carbohydrate group on days 52 and 59 (P < 0.05), but at no other point during the study. Diet did not affect survival (P = 0.34). There were no differences in serum insulin-like growth factor-I or insulin-like growth factor binding protein-3 at sacrifice among the low-carbohydrate arms (P = 0.07 and P = 0.55, respectively). Insulin was significantly lower in the 20% carbohydrate arm (P = 0.03). LAPC-4 xenograft mice fed a low-carbohydrate diet (10-20% carbohydrate kcal) had similar survival as mice consuming NCKD (0% carbohydrate kcal).
Conflict of interest statement
No potential conflicts of interest were disclosed.
Figures


Similar articles
-
Carbohydrate restriction, prostate cancer growth, and the insulin-like growth factor axis.Prostate. 2008 Jan 1;68(1):11-9. doi: 10.1002/pros.20683. Prostate. 2008. PMID: 17999389 Free PMC article.
-
The effects of varying dietary carbohydrate and fat content on survival in a murine LNCaP prostate cancer xenograft model.Cancer Prev Res (Phila). 2009 Jun;2(6):557-65. doi: 10.1158/1940-6207.CAPR-08-0188. Epub 2009 May 26. Cancer Prev Res (Phila). 2009. PMID: 19470786 Free PMC article.
-
The effect of carbohydrate restriction on prostate cancer tumor growth in a castrate mouse xenograft model.Prostate. 2013 Apr;73(5):449-54. doi: 10.1002/pros.22586. Epub 2012 Oct 4. Prostate. 2013. PMID: 23038057 Free PMC article.
-
Low-carbohydrate ketogenic diets in body weight control: A recurrent plaguing issue of fad diets?Obes Rev. 2021 Mar;22 Suppl 2:e13195. doi: 10.1111/obr.13195. Epub 2021 Jan 20. Obes Rev. 2021. PMID: 33471427 Review.
-
Dietary intervention strategies to modulate prostate cancer risk and prognosis.Curr Opin Urol. 2009 May;19(3):263-7. doi: 10.1097/MOU.0b013e328329ea6c. Curr Opin Urol. 2009. PMID: 19300265 Review.
Cited by
-
Worldwide flavor enhancer monosodium glutamate combined with high lipid diet provokes metabolic alterations and systemic anomalies: An overview.Toxicol Rep. 2021 Apr 29;8:938-961. doi: 10.1016/j.toxrep.2021.04.009. eCollection 2021. Toxicol Rep. 2021. PMID: 34026558 Free PMC article. Review.
-
Synergic chemoprevention with dietary carbohydrate restriction and supplementation of AMPK-activating phytochemicals: the role of SIRT1.Eur J Cancer Prev. 2016 Jan;25(1):54-64. doi: 10.1097/CEJ.0000000000000141. Eur J Cancer Prev. 2016. PMID: 25747515 Free PMC article.
-
The ketogenic diet and hyperbaric oxygen therapy prolong survival in mice with systemic metastatic cancer.PLoS One. 2013 Jun 5;8(6):e65522. doi: 10.1371/journal.pone.0065522. Print 2013. PLoS One. 2013. PMID: 23755243 Free PMC article.
-
The Ketogenic Diet in Colorectal Cancer: A Means to an End.Int J Mol Sci. 2023 Feb 12;24(4):3683. doi: 10.3390/ijms24043683. Int J Mol Sci. 2023. PMID: 36835094 Free PMC article. Review.
-
Rationale, Feasibility and Acceptability of Ketogenic Diet for Cancer Treatment.J Cancer Prev. 2017 Sep;22(3):127-134. doi: 10.15430/JCP.2017.22.3.127. Epub 2017 Sep 30. J Cancer Prev. 2017. PMID: 29018777 Free PMC article. Review.
References
-
- American Cancer Society. Cancer Statistics 2009. 2009 [cited; Available from: http://www.cancer.org/docroot/CRI/content/CRI_2_4_1X_What_are_the_key_st....
-
- Baade PD, Youlden DR, Krnjacki LJ. International epidemiology of prostate cancer: geographical distribution and secular trends. Mol Nutr Food Res. 2009;53:171–84. - PubMed
-
- Gann PH, Hennekens CH, Sacks FM, Grodstein F, Giovannucci E, Stampfer MJ. Prospective study of plasma fatty acids and risk of prostate cancer. J Natl Cancer Inst. 1994;86:281–6. - PubMed
-
- Kolonel LN, Nomura AM, Cooney RV. Dietary fat and prostate cancer: current status. J Natl Cancer Inst. 1999;91:414–28. - PubMed
-
- Lopez Fontana CM, Recalde Rincon GM, Messina Lombino D, Uvilla Recupero AL, Perez Elizalde RF, Lopez Laur JD. Body mass index and diet affect prostate cancer development. Actas Urol Esp. 2009;33:741–6. - PubMed
Publication types
MeSH terms
Substances
Grants and funding
LinkOut - more resources
Full Text Sources
Other Literature Sources
Medical
Research Materials
