

Treatment effects in the presence of unmeasured confounding: dealing with observations in the tails of the propensity score distribution--a simulation study
- PMID: 20716704
- PMCID: PMC3025652
- DOI: 10.1093/aje/kwq198
Treatment effects in the presence of unmeasured confounding: dealing with observations in the tails of the propensity score distribution--a simulation study
Abstract
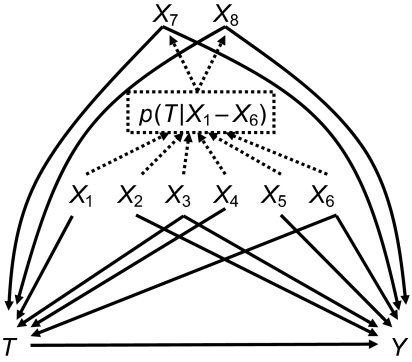
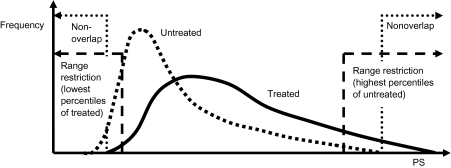
Frailty, a poorly measured confounder in older patients, can promote treatment in some situations and discourage it in others. This can create unmeasured confounding and lead to nonuniform treatment effects over the propensity score (PS). The authors compared bias and mean squared error for various PS implementations under PS trimming, thereby excluding persons treated contrary to prediction. Cohort studies were simulated with a binary treatment T as a function of 8 covariates X. Two of the covariates were assumed to be unmeasured strong risk factors for the outcome and present in persons treated contrary to prediction. The outcome Y was simulated as a Poisson function of T and all X's. In analyses based on measured covariates only, the range of PS's was trimmed asymmetrically according to the percentile of PS in treated patients at the lower end and in untreated patients at the upper end. PS trimming reduced bias due to unmeasured confounders and mean squared error in most scenarios assessed. Treatment effect estimates based on PS range restrictions do not correspond to a causal parameter but may be less biased by such unmeasured confounding. Increasing validity based on PS trimming may be a unique advantage of PS's over conventional outcome models.
Figures
References
-
- Miettinen OS. Stratification by a multivariate confounder score. Am J Epidemiol. 1976;104(6):609–620. - PubMed
-
- Rosenbaum PR, Rubin DB. The central role of the propensity score in observational studies for causal effects. Biometrika. 1983;70(1):41–55.
-
- Glynn RJ, Knight EL, Levin R, et al. Paradoxical relations of drug treatment with mortality in older persons. Epidemiology. 2001;12(6):682–689. - PubMed
