

Transient glutathione depletion determines terminal differentiation in HL-60 cells
- PMID: 20716928
- PMCID: PMC2835889
- DOI: 10.4161/oxim.3.1.10405
Transient glutathione depletion determines terminal differentiation in HL-60 cells
Abstract
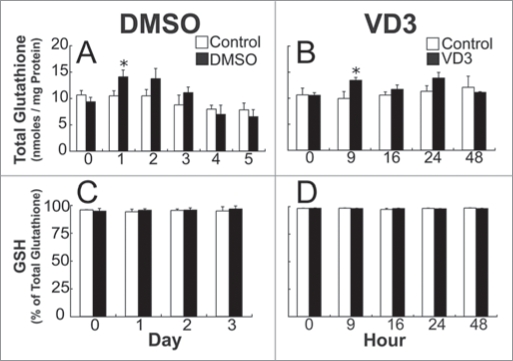
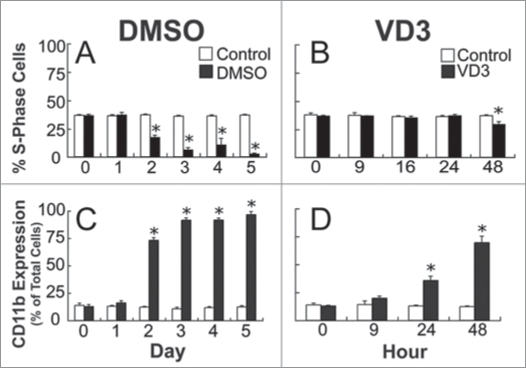
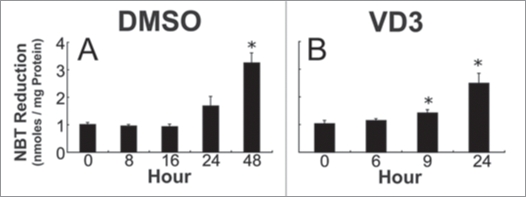
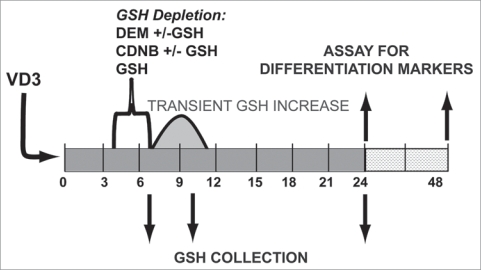
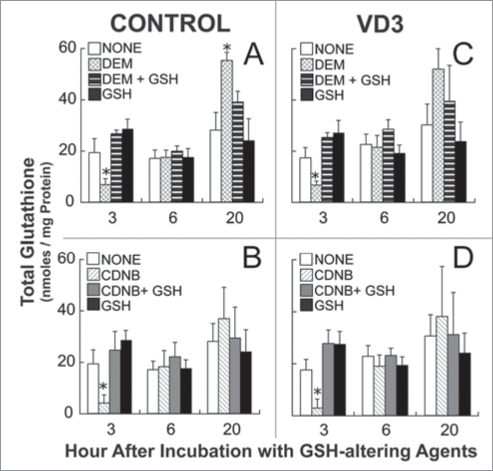
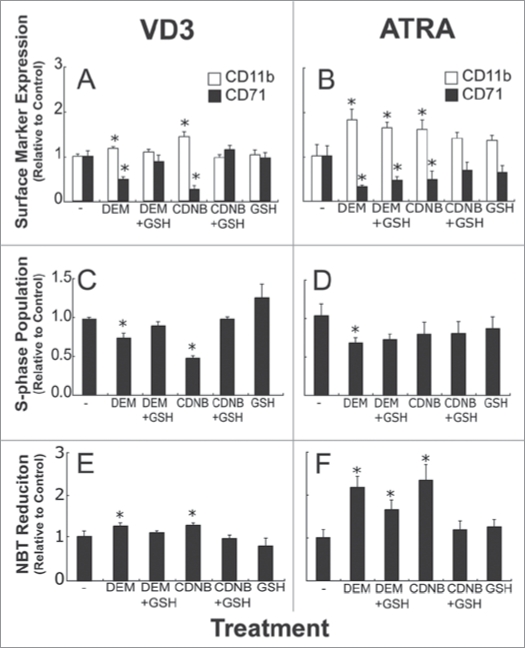
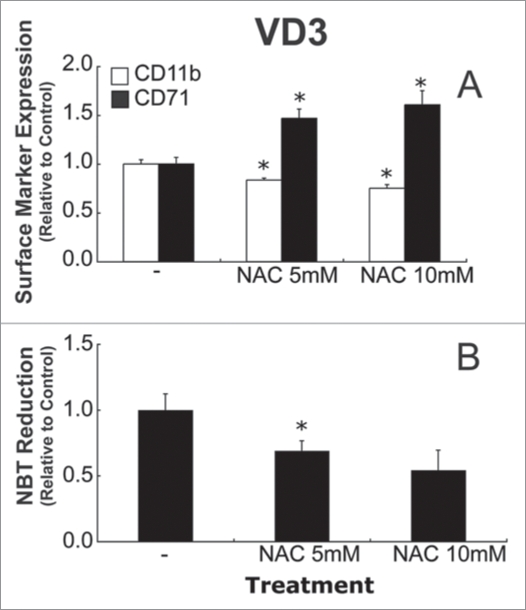
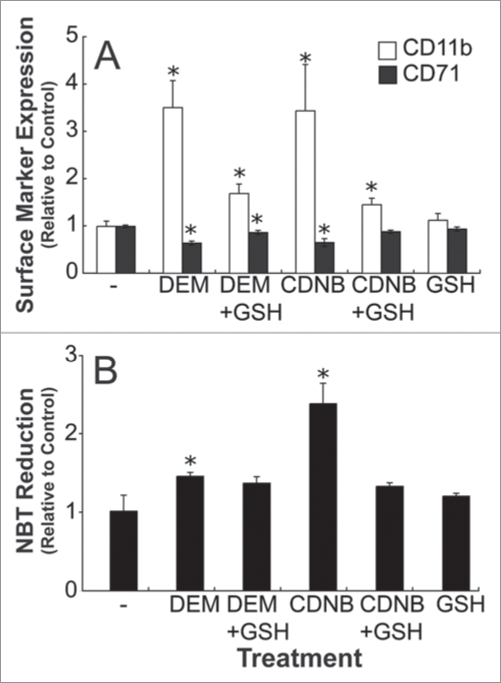
To better define the role of glutathione (GSH) in cell differentiation, the present study measured GSH concentrations during terminal HL-60 cell differentiation, in the presence and absence of differentiation-inducing agents, and in the presence and absence of GSH altering agents. Interestingly, there was a small transient increase in intracellular GSH levels during dimethyl sulfoxide (DMSO) or 1alpha,25-dihydroxyvitamin D3 (VD3) induced differentiation. This increase coincided with an increase in nitroblue tetrazolium (NBT) reduction capacity, a measure of superoxide anion production, but there was no apparent change in the GSH/glutathione disulfide (GSSG) ratio. Surprisingly, treatment of cells with low doses of 1-chloro-2,4-dinitrobenzene (CDNB; 5 microM) or diethylmaleate (DEM; 0.5 mM), which transiently deplete GSH levels to about 40% of control levels, resulted in enhanced differentiation of HL-60 cells exposed to VD3 or all-trans-retinoic acid (ATRA), as well as under un-induced conditions (i.e., spontaneous differentiation). Enhanced differentiation occurred when cells were treated with the GSH-depleting agents 4 hours after treatment with differentiation inducers. These findings indicate that intracellular GSH levels are regulated in a complex fashion during HL-60 cell differentiation, and that transient GSH depletion using low doses of CDNB and DEM enhances the differentiation process.
Figures
Similar articles
-
Enhancement of activity of 1alpha, 25-dihydroxyvitamin D3 for growth inhibition and differentiation induction of human myelomonocytic leukemia cells by tretinoin tocoferil, an alpha-tocopherol ester of all-trans retinoic acid.Blood. 1996 Apr 15;87(8):3384-94. Blood. 1996. PMID: 8605356
-
Synergistic effects of clinically achievable concentrations of 12-O-tetradecanoylphorbol-13-acetate in combination with all-trans retinoic acid, 1alpha,25-dihydroxyvitamin D3, and sodium butyrate on differentiation in HL-60 cells.Oncol Res. 2000;12(9-10):419-27. Oncol Res. 2000. PMID: 11697820
-
Expression of GPI-80, a beta2-integrin-associated glycosylphosphatidylinositol-anchored protein, requires neutrophil differentiation with dimethyl sulfoxide in HL-60 cells.Exp Cell Res. 2003 Jun 10;286(2):199-208. doi: 10.1016/s0014-4827(03)00071-5. Exp Cell Res. 2003. PMID: 12749849
-
Ethacrynic acid and 1 alpha,25-dihydroxyvitamin D3 cooperatively inhibit proliferation and induce differentiation of human myeloid leukemia cells.Leuk Res. 1996 Sep;20(9):781-9. doi: 10.1016/0145-2126(96)00050-1. Leuk Res. 1996. PMID: 8947589
-
Tretinoin tocoferil as a possible differentiation-inducing agent against myelomonocytic leukemia.Leuk Lymphoma. 1997 Jun;26(1-2):43-8. doi: 10.3109/10428199709109156. Leuk Lymphoma. 1997. PMID: 9250786 Review.
Cited by
-
Graphene Oxide-Silver Nanoparticles Nanocomposite Stimulates Differentiation in Human Neuroblastoma Cancer Cells (SH-SY5Y).Int J Mol Sci. 2017 Nov 28;18(12):2549. doi: 10.3390/ijms18122549. Int J Mol Sci. 2017. PMID: 29182571 Free PMC article.
-
Nuclear glutaredoxin 3 is critical for protection against oxidative stress-induced cell death.Free Radic Biol Med. 2015 Aug;85:197-206. doi: 10.1016/j.freeradbiomed.2015.05.003. Epub 2015 May 11. Free Radic Biol Med. 2015. PMID: 25975981 Free PMC article.
-
Downregulation of microsomal glutathione-S-transferase 1 modulates protective mechanisms in differentiated PC12 cells.J Physiol Biochem. 2014 Jun;70(2):375-83. doi: 10.1007/s13105-014-0312-9. Epub 2014 Jan 14. J Physiol Biochem. 2014. PMID: 24419913
-
Assessment of the involvement of oxidative stress and Mitogen-Activated Protein Kinase signaling pathways in the cytotoxic effects of arsenic trioxide and its combination with sulindac or its metabolites: sulindac sulfide and sulindac sulfone on human leukemic cell lines.Med Oncol. 2012 Jun;29(2):1161-72. doi: 10.1007/s12032-011-9920-1. Epub 2011 Apr 27. Med Oncol. 2012. PMID: 21523454
-
HAX1 inhibits apoptosis and promotes maturation of neutrophils.Cell Commun Signal. 2025 Jul 21;23(1):349. doi: 10.1186/s12964-025-02353-2. Cell Commun Signal. 2025. PMID: 40691563 Free PMC article.
References
-
- Oberley LW, Oberley TD, Buettner GR. Cell differentiation, aging and cancer: the possible roles of superoxide and superoxide dismutases. Medical Hypotheses. 1980;6:249–268. - PubMed
-
- Goldman SA. Disease targets and strategies for the therapeutic modulation of endogenous neural stem and progenitor cells. Clin Pharmacol Ther. 2007;82:453–460. - PubMed
-
- Maródi L, Notarangelo LD. Immunological and genetic bases of new primary immunodeficiencies. Nat Rev Immunol. 2007;7:851–861. - PubMed
-
- Chien KR, Domian IJ, Parker KK. Cardiogenesis and the complex biology of regenerative cardiovascular medicine. Science. 2008;322:1494–1497. - PubMed
Publication types
MeSH terms
Substances
Grants and funding
LinkOut - more resources
Full Text Sources
