. 2010 Mar-Apr;3(2):153-65.
doi: 10.4161/oxim.3.2.11758.

Wnt1 neuroprotection translates into improved neurological function during oxidant stress and cerebral ischemia through AKT1 and mitochondrial apoptotic pathways

Affiliations
Free PMC article

Wnt1 neuroprotection translates into improved neurological function during oxidant stress and cerebral ischemia through AKT1 and mitochondrial apoptotic pathways

Zhao Zhong Chong et al. Oxid Med Cell Longev. 2010 Mar-Apr.
Free PMC article

Abstract

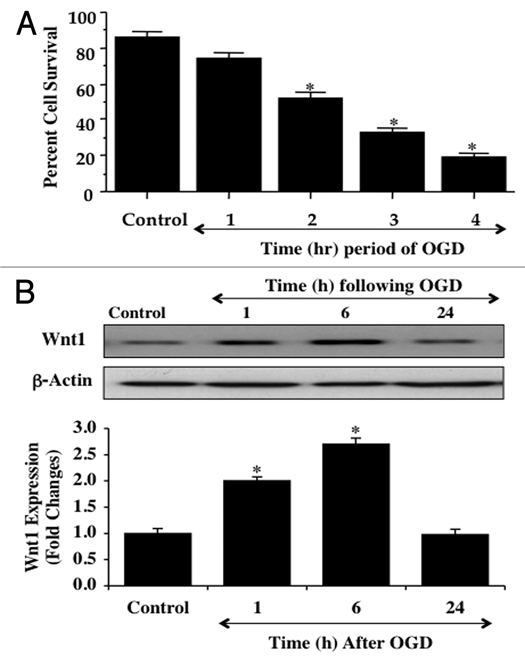
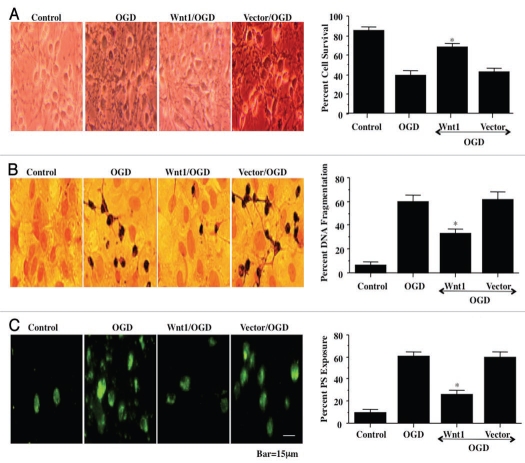
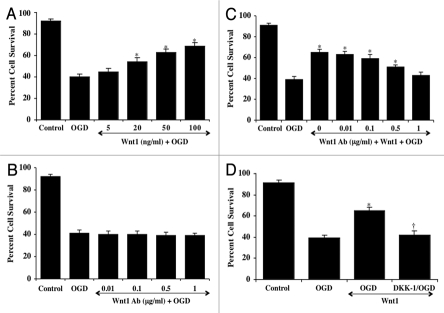
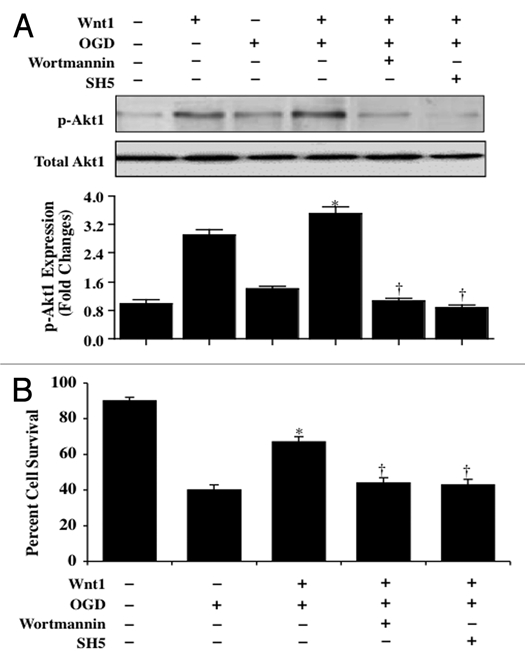
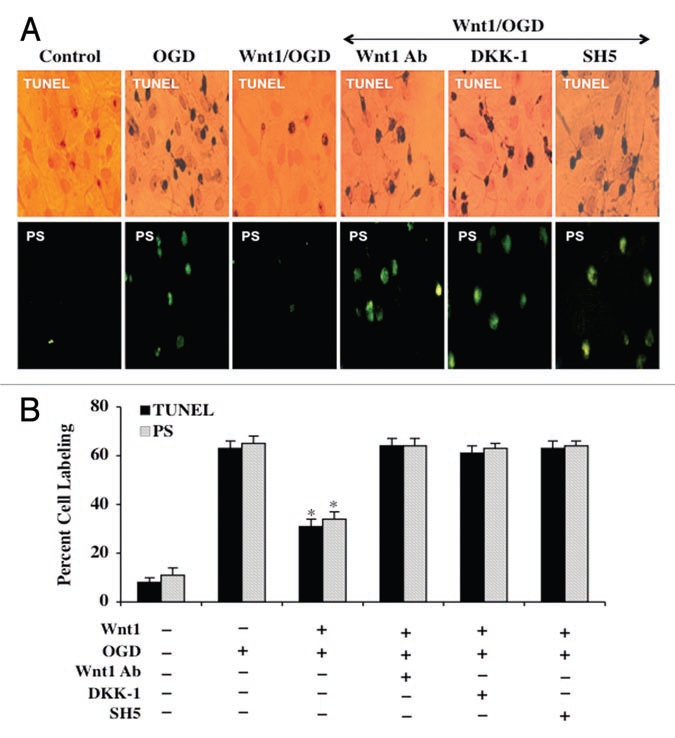
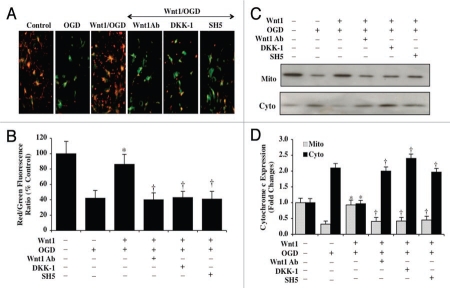
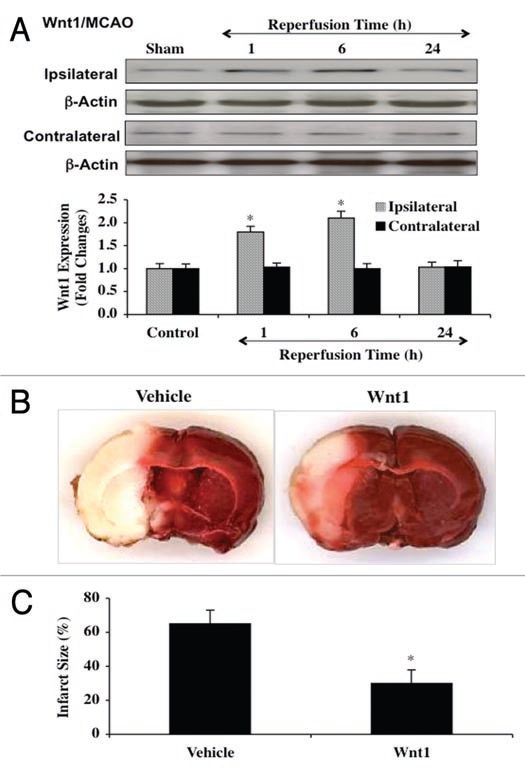
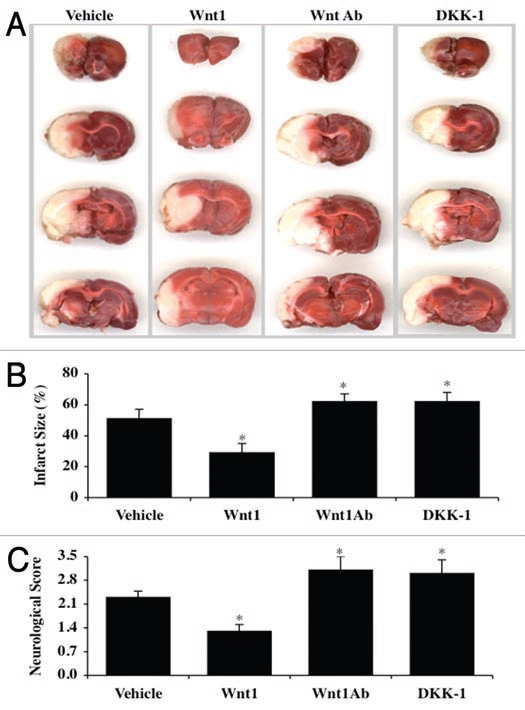
Although essential for the development of the nervous system, Wnt1 also has been associated with neurodegenerative disease and cognitive loss during periods of oxidative stress. Here we show that endogenous expression of Wnt1 is suppressed during oxidative stress in both in vitro and in vivo experimental models. Loss of endogenous Wnt1 signaling directly correlates with neuronal demise and increased functional deficit, illustrating that endogenous neuronal Wnt1 offers a vital level of intrinsic cellular protection against oxidative stress. Furthermore, transient overexpression of Wnt1 or application of exogenous Wnt1 recombinant protein is necessary to preserve neurological function and rescue neurons from apoptotic membrane phosphatidylserine externalization and genomic DNA degradation, since blockade of Wnt1 signaling with a Wnt1 antibody or dickkopf related protein 1 abrogates neuronal protection by Wnt1. Wnt1 ultimately relies upon the activation of Akt1, the modulation of mitochondrial membrane permeability, and the release of cytochrome c to control the apoptotic cascade, since inhibition of Wnt1 signaling, the phosphatidylinositol 3-kinase pathway, or Akt1 activity abrogates the ability of Wnt1 to block these apoptotic components. Our work identifies Wnt1 and its downstream signaling as cellular targets with high clinical potential for novel treatment strategies for multiple disorders precipitated by oxidative stress.


Figures

Figure 1
Figure 1
OGD leads to progressive injury in neurons and reduces endogenous Wnt1 expression over time. In A, primary hippocampal neurons were exposed to progressive durations of OGD at 1, 2, 3 and 4 hours and neuronal survival was determined 24 hours later by trypan blue dye exclusion assay. Neuronal survival was decreased to 73 ± 3% (1 hour), 51 ± 4% (2 hours), 32 ± 3% (3 hours), and 20 ± 3% (4 hours) following OGD exposure when compared with untreated control cultures (86 ± 3%, *p < 0.01 vs. Control). Each data point represents the mean and SEM from 6 experiments. In B, neuronal protein extracts (50 µg/lane) were immunoblotted with anti-Wnt1 (Wnt1) at 1, 6 and 24 hours following OGD exposure. Wnt1 expression is initially elevated at 1 hour and 6 hours, but then progressively and significantly is reduced at 24 hours following OGD exposure (*p < 0.01 vs. control)
Figure 2
Figure 2
Transient transfection of Wnt1 increases neuronal survival and prevents genomic DNA degradation and membrane ps externalization. In A, overexpression of Wnt1 was performed under the control of a CMV promoter with Wnt1 cDNA and cell survival was determined 24 hours after OGD exposure through the trypan blue dye exclusion method. Representative images illustrate decreased trypan blue staining during Wnt1 transient transfection. Significant cell injury and trypan blue staining occurs during OGD alone in wildtype cells and during vector transfection. Quantification of data demonstrates that OGD significantly decreased percent cell survival when compared to the control cells. In contrast, Wnt1 significantly increased cell survival (*p < 0.01 vs. OGD). Each data point represents the mean and SEM from six experiments. Control = untreated neurons. In B, overexpression of Wnt1 was performed under the control of a CMV promoter with Wnt1 cDNA and genomic DNA degradation was determined 24 hours after OGD exposure through TUNEL. Representative images illustrate decreased TUNEL staining during Wnt1 transient transfection. Significant DNA fragmentation occurs during OGD alone in wildtype cells and during vector transfection. Quantification of data demonstrates that OGD results in marked DNA fragmentation when compared to the control cells. In contrast, Wnt1 significantly prevents DNA fragmentation (*p < 0.01 vs. OGD). Each data point represents the mean and SEM from six experiments. Control = untreated neurons. In C, overexpression of Wnt1 was performed under the control of a CMV promoter with Wnt1 cDNA and membrane PS externalization was determined 24 hours after OGD exposure through annexin V phycoerythrin (green fluorescence). Representative images illustrate decreased PS staining during Wnt1 transient transfection. Significant membrane PS externalization occurs during OGD alone in wildtype cells and during vector transfection. Quantification of data demonstrates that OGD results in marked PS exposure when compared to the control cells. In contrast, Wnt1 significantly prevents PS externalization (*p < 0.01 vs. OGD). Each data point represents the mean and SEM from six experiments. Control, untreated neurons.
Figure 3
Figure 3
Wnt1 signaling is necessary for neuronal protection against OGD. In A, increasing concentrations of Wnt1 protein result in significantly increased neuronal survival assessed by trypan blue exclusion 24 hours after OGD (*p < 0.01 vs. OGD). In B, increasing concentrations of an antibody to Wnt1 (Wnt1Ab) during OGD do not alter neuronal survival assessed by trypan blue exclusion 24 hours after OGD when compared to neurons exposed to OGD alone. In C, increasing concentrations of an antibody to Wnt1 (Wnt1Ab) applied with Wnt1 (100 ng/ml) resulted in progressive loss of Wnt1 protection and increased neuronal cell injury assessed by trypan blue staining 24 hours after OGD (*p < 0.01 vs. OGD). In D, inhibition of Wnt1 signaling with DKK-1 (0.5 µg/ml), an antagonist of the Wnt/β-catenin pathway, administered with Wnt1 (100 ng/ml) significantly reduces protection by Wnt1 and neuronal cell survival assessed by trypan blue staining 24 hours after OGD (*p < 0.01 vs. OGD; †p < 0.01 vs. Wnt1/OGD). In all cases control = untreated neurons. Each data point represents the mean and SEM from six experiments.
Figure 4
Figure 4
Wnt1 relies upon the PI 3-K pathway and Akt1 to provide neuronal protection. In A, primary neuronal protein extracts (50 µ/lane) were immunoblotted with anti-phosphorylated-Akt1 (p-Akt1, Ser473) or anti-total Akt1 at 6 hours following OGD. Application of Wnt1 (100 ng/ml) in untreated wildtype neurons or in the presence of OGD significantly elevated p-Akt1 expression to a greater extent than OGD alone. This increased expression of p-Akt1 by Wnt1 was blocked by the PI 3-K inhibitor wortmannin (0.5 µM) and by the specific Akt1 inhibitor SH-5 (20 µM). Total Akt1 is not altered (*p < 0.01, vs. OGD; †p < 0.01 vs. Wnt1/OGD). Each data point represents the mean and SEM from six experiments. In B, primary neurons treated with Wnt1 (100 ng/ml) increased neuronal survival assessed by trypan blue staining 24 hours after OGD. Yet, application of wortmannin (0.5 µM) or SH-5 (20 µM) at concentrations that block activation of Akt1 activation significantly reduced protection by Wnt1 24 hours after OGD (*p < 0.01, vs. OGD; †p < 0.01 vs. Wnt1/OGD). Each data point represents the mean and SEM from six experiments.
Figure 5
Figure 5
Wnt1 uses Akt1 to block apoptotic membrane PS exposure and genomic DNA degradation during OGD. In A, representative images illustrate that recombinant human Wnt1 protein (100 ng/ml) significantly blocks neuronal genomic DNA degradation assessed by TUNEL and membrane PS externalization assessed by annexin V phycoerythrin (green fluorescence) 24 hours following OGD. In contrast, inhibition of Wnt1 (100 ng/ml) signaling with Wnt1Ab (1 µg/ml) or with application of DKK-1 (0.5 µg/ml) or inhibition of Akt1 with SH-5 (20 µM) during Wnt1 application leads to the loss of Wnt1 protection. In B, quantification of data illustrates that DNA fragmentation and membrane PS externalization were significantly increased 24 hours following OGD when compared to untreated neuronal control cultures during Wnt1 (100 ng/ml) application with Wnt1Ab (1 µg/ml), DKK-1 (0.5 µg/ml), or SH-5 (20 µM). Each data point represents the mean and SEM from six experiments.
Figure 6
Figure 6
Wnt1 inhibits mitochondrial depolarization and prevents the release of cytochrome c during OGD. In A, OGD leads to a significant decrease in the red/green fluorescence intensity ratio of mitochondria using the cationic membrane potential indicator JC-1 within 3 hours when compared with untreated control neurons, demonstrating that OGD leads to mitochondrial membrane depolarization. Application of Wnt1 (100 ng/ml) during OGD significantly increased the red/green fluorescence intensity of mitochondria in neurons, illustrating that mitochondrial membrane potential was restored by Wnt1. In contrast, inhibition of Wnt1 (100 ng/ml) signaling with Wnt1Ab (1 µg/ml) or with application of DKK-1 (0.5 µg/ml) or inhibition of Akt1 with SH-5 (20 µM) during Wnt1 application and OGD resulted in mitochondrial depolarization similar to OGD exposure alone. In B, the relative ratio of red/green fluorescent intensity of mitochondrial staining in untreated control neurons, in neurons exposed to OGD, during Wnt1 (100 ng/ml)/OGD application alone or during Wnt1 (100 ng/ml)/OGD with Wnt1Ab (1 µg/ml), DKK-1 (0.5 µg/ml), or SH-5 (20 µM) was measured in six independent experiments with analysis performed using the public domain NIH Image program (http://rsb.info.nih.gov/nih-image) (Wnt1/OGD vs. OGD, *p < 0.01; Wnt1/OGD with Wnt1Ab, DKK-1, or SH-5 vs. Wnt1/OGD, †p < 0.01). In C and D, equal amounts of mitochondrial (mito) or cytosol (cyto) protein extracts (50 µg/lane) were immunoblotted demonstrating that Wnt1 (100 ng/ml) significantly prevented cytochrome c release from mitochondria within 3 hours after OGD but Wnt1Ab (1 µg/ml), DKK-1 (0.5 µg/ml), or SH-5 (20 µM) during Wnt1/OGD application prevented Wnt1 from maintaining cytochrome c in the mitochondria (Wnt1/OGD vs. OGD, *p < 0.01; Wnt1/OGD with Wnt1Ab, DKK-1, or SH-5 vs. Wnt1/OGD, †p < 0.01).
Figure 7
Figure 7
Transient cerebral ischemia blocks endogenous Wnt1 cortical expression but exogenous Wnt1 is protective against cerebral ischemia. In A and B, focal cerebral ischemia was induced by insertion of a monofilament thread (4-0) into the internal carotid artery and blockade of the origin of MCA. Reperfusion was performed following 90 minutes ischemia by withdrawal of the thread. For A, cortical protein extracts (50 µg/lane) were immunoblotted with anti-Wnt1 (Wnt1) at 1, 6 and 24 hours following OGD exposure. Similar to the effects upon Wnt1 expression with OGD in neuronal cultures, Wnt1 expression is initially elevated at 1 hour and 6 hours, but then progressively and significantly is reduced at 24 hours following OGD exposure (*p < 0.01 vs. control). Wnt1 expression on the contralateral non-infarction hemisphere was not altered from control, illustrating that the generation of cerebral ischemia directly led to changes in endogenous Wnt1 expression. In B, Wnt1 protein (24 µg/kg) was injected into the internal carotid artery through the external carotid artery at 30 minutes prior to the onset of MCAO and at the onset of reperfusion. Animals were euthanized 24 hours following ischemia and the infarct size was determined by 2,3,5-triphenytetrazolium (TTC) staining. Representative images show that the infarct size (white in color) was significantly reduced by treatment with Wnt1 protein. In C, quantitative results demonstrate that infarct size was significantly decreased by Wnt1 (24 µg/kg) treatment following reperfusion after cerebral ischemia. The total infarct size was expressed as a percentage of the contralateral hemisphere (*p < 0.05 vs. vehicle). In all cases, each data point represents the mean and SEM from six experiments.
Figure 8
Figure 8
Wnt1 signaling is required for reduction in cerebral infarction following transient cerebral MCAO and maintains neurological recovery. In A, B and C, focal cerebral ischemia was induced by insertion of a monofilament thread (4-0) into the internal carotid artery and blockade of the origin of MCA. Reperfusion was performed following 90 minutes ischemia by withdrawal of the thread. In A, Wnt1 protein (24 µg/kg), Wnt1Ab (60 µg/kg), or DKK-1 (30 µg/kg) was injected into the internal carotid artery through the external carotid artery at 30 min prior to the onset of MCAO and at the onset of reperfusion. Animals were euthanized 24 hours following ischemia and infarct size was determined by 2,3,5-triphenytetrazolium (TTC) staining. Representative images illustrate that infarct size (white in color) was significantly reduced by treatment with Wnt1 protein. In contrast, infarct size was markedly increased by treatment with Wnt1Ab or DKK-1 during MCAO. In B, quantitative results demonstrate that infarct size was significantly decreased by Wnt1 (24 µg/kg) treatment following reperfusion after MCAO. However, infarct size was substantially increased with Wnt1Ab (60 µg/kg) or DKK-1 (30 µg/kg) administration during MCAO. The total infarct size was expressed as a percentage of the contralateral hemisphere (*p < 0.05 vs. vehicle). In C, the neurological deficit score was assessed in animals 24 hours following MCAO and reperfusion of a 90 minute period. Wnt1 (24 µg/kg) significantly lowered the neurological deficit score when compared to vehicle only treated animals. In contrast, Wnt1Ab (60 µg/kg) or DKK-1 (30 µg/kg) significantly increased the neurological deficit score (*p < 0.05 vs. vehicle). In all cases, each data point represents the mean and SEM from six experiments.

Similar articles

Cited by

References

    1. Adachi K, Mirzadeh Z, Sakaguchi M, Yamashita T, Nikolcheva T, Gotoh Y, et al. beta-Catenin signaling promotes proliferation of progenitor cells in the adult mouse subventricular zone. Stem Cells. 2007;25:2827–2836. - PubMed
    1. Bakre MM, Hoi A, Mong JC, Koh YY, Wong KY, Stanton LW. Generation of multipotential mesendodermal progenitors from mouse embryonic stem cells via sustained Wnt pathway activation. J Biol Chem. 2007;282:31703–31712. - PubMed
    1. Cheng CW, Yeh JC, Fan TP, Smith SK, Charnock-Jones DS. Wnt5a-mediated non-canonical Wnt signalling regulates human endothelial cell proliferation and migration. Biochem Biophys Res Commun. 2008;365:285–290. - PubMed
    1. Jozwiak J, Kotulska K, Grajkowska W, Jozwiak S, Zalewski W, Oldak M, et al. Upregulation of the WNT pathway in tuberous sclerosis-associated subependymal giant cell astrocytomas. Brain Dev. 2007;29:273–280. - PubMed
    1. Maiese K. Triple play: Promoting neurovascular longevity with nicotinamide, WNT, and erythropoietin in diabetes mellitus. Biomed Pharmacother. 2008;62:218–232. - PMC - PubMed

Publication types

MeSH terms

LinkOut - more resources