. 2011 Feb;31(2):658-70.
doi: 10.1038/jcbfm.2010.142. Epub 2010 Aug 18.

The cytokine response to human traumatic brain injury: temporal profiles and evidence for cerebral parenchymal production

Affiliations

The cytokine response to human traumatic brain injury: temporal profiles and evidence for cerebral parenchymal production

Adel Helmy et al. J Cereb Blood Flow Metab. 2011 Feb.

Abstract

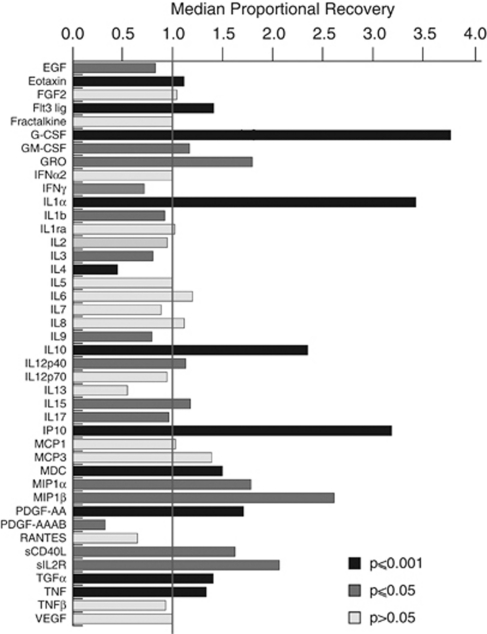
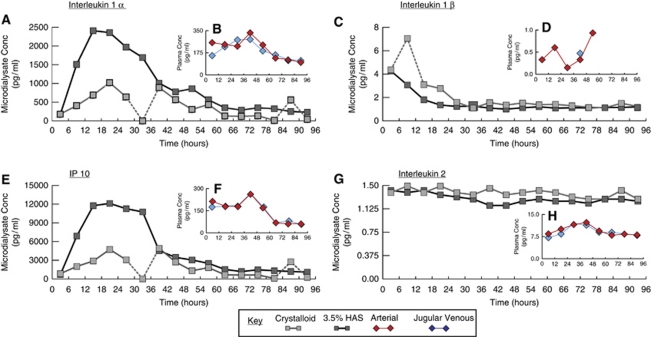
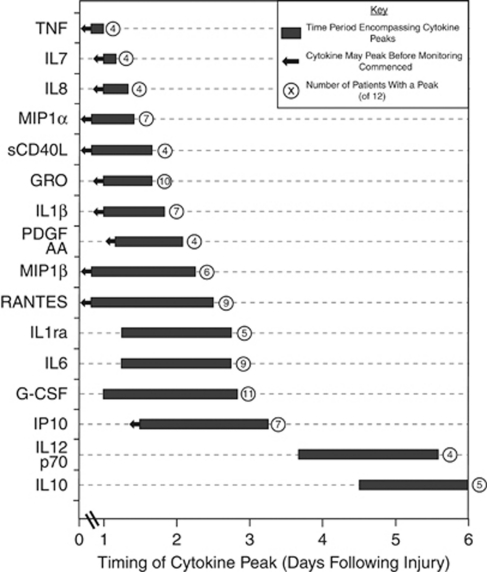
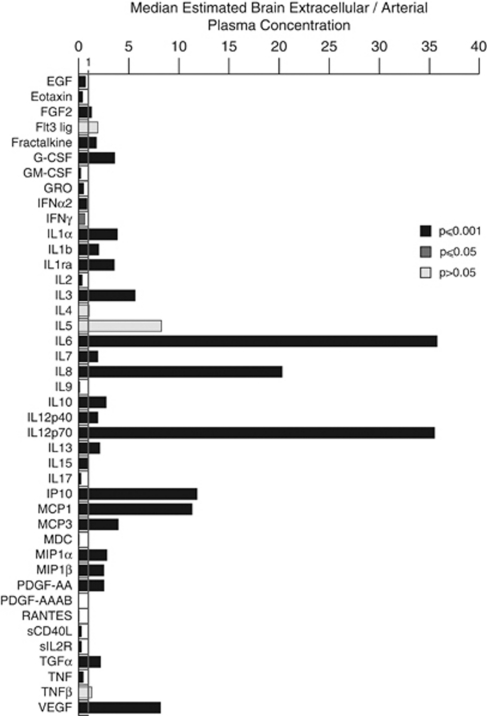
The role of neuroinflammation is increasingly being recognised in a diverse range of cerebral pathologies, including traumatic brain injury (TBI). We used cerebral microdialysis and paired arterial and jugular bulb plasma sampling to characterise the production of 42 cytokines after severe TBI in 12 patients over 5 days. We compared two microdialysis perfusates in six patients: central nervous system perfusion fluid and 3.5% human albumin solution (HAS); 3.5% HAS has a superior fluid recovery (95.8 versus 83.3%), a superior relative recovery in 18 of 42 cytokines (versus 8 of 42), and a qualitatively superior recovery profile. All 42 cytokines were recovered from the human brain. Sixteen cytokines showed a stereotyped temporal peak, at least twice the median value for that cytokine over the monitoring period; day 1: tumour necrosis factor, interleukin (IL)7, IL8, macrophage inflammatory protein (MIP)1α, soluble CD40 ligand, GRO, IL1β, platelet derived growth factor (PDGF)-AA, MIP1β, RANTES; day 2: IL1 receptor antagonist (ra). IL6, granulocyte-colony stimulating factor (G-CSF), chemokine CXC motif ligand 10 (IP10); days 4 to 5: IL12p70, IL10. Brain extracellular fluid concentrations were significantly higher than plasma concentrations for 19 cytokines: basic fibroblast growth factor (FGF2), G-CSF, IL1α, IL1β, IL1ra, IL3, IL6, IL8, IL10, IL12p40, IL12p70, IP10, monocyte chemotactic protein (MCP)1, MCP3, MIP1α, MIP1β, PDGF-AA, transforming growth factor (TGF)α and vascular endothelial growth factor. No clear arterio-jugular venous gradients were apparent. These data provide evidence for the cerebral production of these cytokines and show a stereotyped temporal pattern after TBI.


Figures

Figure 1
Figure 1
Proportional cytokine recovery. The histogram plots the median proportional recovery for each cytokine, defined as the cytokine concentration (3.5% HAS perfusate)/cytokine concentration (crystalloid perfusate). A Wilcoxon signed rank test two-tailed was used to compare the cytokine values derived from the two catheters. Only paired samples were used for this calculation. The dark coloured bars indicate the cytokines that had a statistically significant difference between the two perfusates (grey bars P⩽0.05, black bars P⩽0.001). HAS, human albumin solution.
Figure 2
Figure 2
Representative cytokine temporal profiles in microdialysate and plasma. The line graphs illustrate representative data obtained from patient 1. The larger panels (A, C, E, G) illustrate the microdialysate-derived values with 3.5% HAS and crystalloid perfusates. The inset panels (B, D, F, H) show the paired arterial and jugular venous plasma values. Sampling frequency differs between the microdialysate (6 hourly) and the plasma (12 hourly). Timescales on horizontal axes are relative to the beginning of microdialysis. Dashed lines link time points that appear aberrant. For IL1α, IL1β, and IP10, their concentrations in microdialysates are several fold higher than in the corresponding plasma samples. Contrastingly, for IL2, plasma concentrations are higher than for microdialysates. Microdialysate cytokine temporal profiles appear independent of those in plasma. These cytokines are chosen to illustrate that the temporal profiles may show a well-defined peak (IL1α and IP10), high initial values that then decrease, suggesting the downstroke of an earlier peak (ILβ), or stability over the entire monitoring period (IL2), suggesting consistent catheter performance. IL, interleukin; HAS, human albumin solution.
Figure 3
Figure 3
Timing of cytokine peaks in microdialysates. A peak is defined as two consecutive values greater than twice the median concentration for each cytokine recovered with 3.5% HAS perfusate. For further explanation, see the ‘Discussion' section. For any cytokine with peaks in four or more patients clustered within a 48-hour period, a box is plotted on the timeline encompassing these peak time points. The cytokine with the earliest peaks is plotted at the top of the figure. Some peaks occurred in the first sample in the monitoring period. In this circumstance, it is not possible to distinguish whether this is the ‘true' peak or a downstroke of an earlier peak that occurred before the start of monitoring (e.g., Figure 2C, IL1β with 3.5% HAS perfusate). In such cases, an arrow is used to indicate that the ‘true' peak may precede the box plotted on the timeline. Not all patients had peaks for every cytokine. The number following the box on the timeline indicates how many patients (out of 12) had a peak within the box. Cytokines that only had peaks in four or fewer patients are not plotted. G-CSF, granulocyte colony-stimulating factor; IL, interleukin; TNF, tumour necrosis factor; HAS, human albumin solution.
Figure 4
Figure 4
Estimated brain extracellular/plasma arterial concentration. The histogram illustrates the median ratio of estimated brain extracellular concentration (calculated from 3.5% HAS-perfused catheter values and RR values in Table 3) divided by the paired plasma arterial concentration. The paired samples were used to calculate the ratio at each time point, and the median of these values plotted. A ratio >1 indicates that the estimated brain extracellular concentration is higher than the arterial plasma concentration. A Wilcoxon signed rank two-tailed test was used to compare the cytokine concentrations in brain extracellular space and arterial plasma. The dark coloured bars indicate the cytokines that had a statistically significant difference between the two perfusates (grey bars P⩽0.05, black bars P⩽0.001). EGF, epidermal growth factor; G-CSF, granulocyte colony-stimulating factor; GM-CSF, granulocyte macrophage colony-stimulating factor; IFN, interferon; IL, interleukin; RR, relative recovery; TGF, transforming growth factor; TNF, tumour necrosis factor; VEGF, vascular endothelial growth factor; HAS, human albumin solution.

References

    1. Banks WA, Erickson MA. The blood-brain barrier and immune function and dysfunction. Neurobiol Dis. 2010;37:26–32. - PubMed
    1. Bellander BM, Cantais E, Enblad P, Hutchinson P, Nordstrom CH, Robertson C, Sahuquillo J, Smith M, Stocchetti N, Ungerstedt U, Unterberg A, Olsen NV. Consensus meeting on microdialysis in neurointensive care. Intensive Care Med. 2004;30:2166–2169. - PubMed
    1. Berger RP, Táasan S, Rand A, Lokshin A, Kochanek P. Multiplex assessment of serum biomarker concentrations in well-appearing children with inflicted traumatic brain injury. Pediatr Res. 2009;65:97–102. - PubMed
    1. Buttram SD, Wisniewski SR, Jackson EK, Adelson PD, Feldman K, Bayir H, Berger RP, Clark RS, Kochanek PM. Multiplex assessment of cytokine and chemokine levels in cerebrospinal fluid following severe pediatric traumatic brain injury: effects of moderate hypothermia. J Neurotrauma. 2007;24:1707–1717. - PubMed
    1. Chiaretti A, Antonelli A, Mastrangelo A, Pezzotti P, Tortorolo L, Tosi F, Genovese O. Interleukin-6 and nerve growth factor upregulation correlates with improved outcome in children with severe traumatic brain injury. J Neurotrauma. 2008;25:225–234. - PubMed

Publication types