. 2010 Dec;11(4):689-708.
doi: 10.1007/s10162-010-0229-0. Epub 2010 Aug 18.

Effects of pulse phase duration and location of stimulation within the inferior colliculus on auditory cortical evoked potentials in a guinea pig model

Affiliations

Effects of pulse phase duration and location of stimulation within the inferior colliculus on auditory cortical evoked potentials in a guinea pig model

Anke Neuheiser et al. J Assoc Res Otolaryngol. 2010 Dec.

Abstract

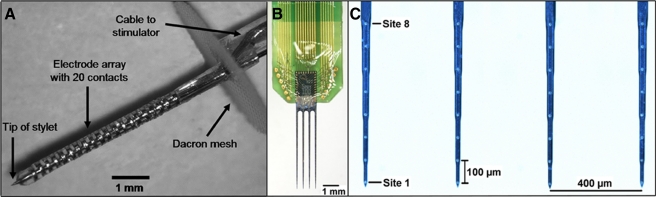
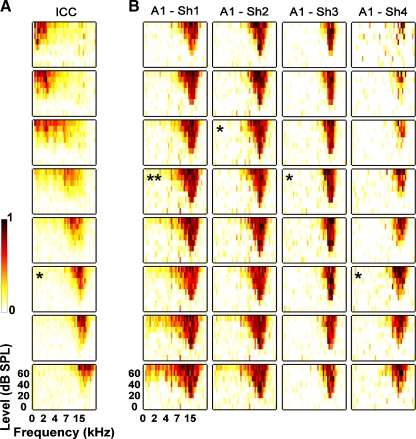
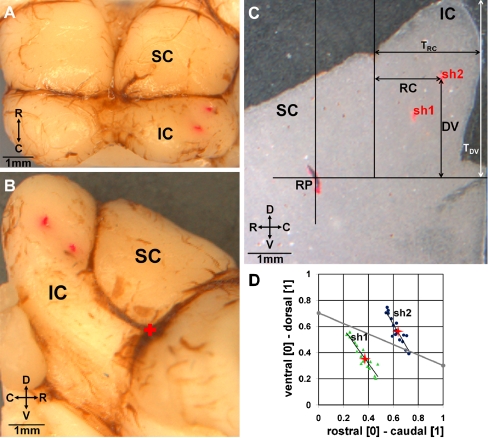
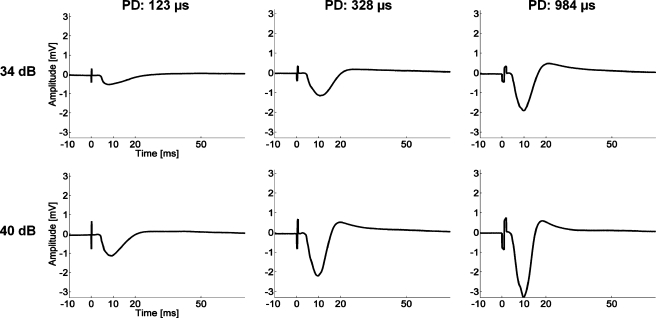
The auditory midbrain implant (AMI), which consists of a single shank array designed for stimulation within the central nucleus of the inferior colliculus (ICC), has been developed for deaf patients who cannot benefit from a cochlear implant. Currently, performance levels in clinical trials for the AMI are far from those achieved by the cochlear implant and vary dramatically across patients, in part due to stimulation location effects. As an initial step towards improving the AMI, we investigated how stimulation of different regions along the isofrequency domain of the ICC as well as varying pulse phase durations and levels affected auditory cortical activity in anesthetized guinea pigs. This study was motivated by the need to determine in which region to implant the single shank array within a three-dimensional ICC structure and what stimulus parameters to use in patients. Our findings indicate that complex and unfavorable cortical activation properties are elicited by stimulation of caudal-dorsal ICC regions with the AMI array. Our results also confirm the existence of different functional regions along the isofrequency domain of the ICC (i.e., a caudal-dorsal and a rostral-ventral region), which has been traditionally unclassified. Based on our study as well as previous animal and human AMI findings, we may need to deliver more complex stimuli than currently used in the AMI patients to effectively activate the caudal ICC or ensure that the single shank AMI is only implanted into a rostral-ventral ICC region in future patients.


Figures

FIG. 1
FIG. 1
A Image of the AMI array developed by Cochlear Ltd. (Lane Cove, Australia). The array is 6.2 mm long with a diameter of 0.4 mm. It consists of 20 platinum ring electrodes linearly spaced at an interval of 200 μm. Each site has a thickness of 100 μm (surface area of 126,000 μm²). A stainless steel stylet is positioned through the axial center of the silicone carrier to enable insertion of the array into the brain and is intended for removal after placement for human implantation. Further details on the AMI electrode array are included in Lenarz et al. (2006b). B A multi-site silicon substrate “Michigan” probe consisting of four shanks magnified in C that were each separated by 400 μm, 5 mm long and 15 μm thick. Along each shank, eight iridium sites (400 μm2 surface area) were linearly spaced at a distance of 100 μm.
FIG. 2
FIG. 2
Frequency response maps (FRMs) recorded on 8 different sites (only 8 of 20 sites shown) along the tonotopic gradient of the central nucleus of the inferior colliculus (ICC) with the AMI array (A) and on 32 different sites within a specific frequency region (~16 kHz) of the primary auditory cortex (A1) with a multi-site probe (4 shanks each with 8 sites) (B). For each FRM, the x-axis is frequency (0–30 kHz, 8 steps/octave) and the y-axis is stimulus intensity (0–70 dB SPL, 10 dB steps). The color scale corresponds to normalized driven spike rate where all negative FRM values were set to zero to improve visualization. The FRM labeled with an asterisk in A corresponds to the selected AMI site (16 kHz region) used for electrical stimulation in the ICC. The FRMs in B with an asterisk correspond to sites located within the main input layer of A1 and the double asterisk represents the site selected for analysis since it had a best frequency closest to that of the ICC site.
FIG. 3
FIG. 3
Reconstruction of the AMI array placements in the inferior colliculus (IC) for one animal. A View of the dorsal surface of the IC and superior colliculus (SC). The two red dots indicate where we inserted the AMI array. B Lateral view of the right IC and SC in which the red plus sign represents the location of our reference point (RP) used for normalizing the array locations across animals. C A 40-μm-thick sagittal slice detailing our coordinate system used to quantify the location of the trajectory for each array placement (appears as dots in each slice since the array was inserted at a 45º angle to the sagittal plane). D The normalized coordinates (RC divided by TRC, DV divided by TDV) are plotted across several slices (dots) for each trajectory (placement 1: green, placement 2: blue). Since these coordinates systematically change across slices, we only selected the values for the slice corresponding to 0.54 from the lateral edge to the midline (red pluses) that were then later displayed on a single plot across all animals. The red pluses in D correspond to the red dots caused by the track of the AMI in C. The gray line in D divides which locations we labeled as caudal (above the line) and rostral (below the line) and was based on the threshold values shown in Figure 6. For further details on our reconstruction and grouping methods, see Methods: “ICC probe histology and site locations”. C caudal, D dorsal, R rostral, V ventral.
FIG. 4
FIG. 4
Averaged evoked potentials (20 trials) recorded on the main input layer site in primary auditory cortex in response to stimulation with an AMI site for three different phase durations (PDs) and two current levels. The sites are located within a 16-kHz region. The stimulus started at 0 ms and elicited an electrical artifact that systematically changed with PD and level.
FIG. 5
FIG. 5
Threshold versus phase duration curves for different stimulation locations within the central nucleus of the inferior colliculus. Thresholds are plotted in microamperes (A), in percentage relative to the threshold at 41 μs (B), and total charge per phase (C). The locations are divided into rostral (green) and caudal (blue) groups (for more details on the grouping method, see Methods: “ICC probe histology and site locations”). Different phase durations were used across curves (see Table 1).
FIG. 6
FIG. 6
Contour plots of activation thresholds in the primary auditory cortex (A1) as a function of stimulation location along the normalized isofrequency domain of the central nucleus of the inferior colliculus (ICC). Each pair of plots (AE) corresponds to a different phase duration (PD). Each dot corresponds to a different stimulation site. In each contour plot, a black line is present that corresponds to the steepest gradient axis for threshold values, as depicted in the plot below that shows threshold versus location along that steepest axis (at an angle below the horizontal line; 0 along the steepest gradient axis corresponds to the location of the circle in the contour plot). For all PDs, there was a significant trend of lower thresholds for more rostral–ventral locations of the ICC. For longer PDs, this trend became less clear though maintained significance (P < 0.05). The gray line in A was based on our visual determination of the midpoint of the threshold gradient along this caudal–dorsal to rostral–ventral gradient in which a reasonable number of caudal and rostral locations were separated into two groups for our analyses. The color scale of the contour plots corresponds to threshold levels in decibel relative to 1 μA. Only PDs of 41 and 123 μs consist of all 21 locations while the other PDs consist of a subset of these points (see Table 1). Not all points were visible since two locations consisted of two points with identical coordinates ([0.26, 0.25] and [0.65, 0.34]; stimulation of two different frequency regions for the same AMI array placement). For example, in A only 19 of the 21 points are visible. The threshold values for each pair were averaged for the contour plots. For more details on how we identified the different ICC locations or calculated the steepest gradient axis, see “Methods”.
FIG. 7
FIG. 7
Contour plots of evoked potential magnitudes in the primary auditory cortex (A1) as a function of stimulation location along the normalized isofrequency domain of the central nucleus of the inferior colliculus (ICC) for one stimulus level of 40 dB relative to 1 μA. Each pair of plots (AE) corresponds to a different phase duration (PD). Each dot corresponds to a different stimulation site. In each contour plot, a black line is present that corresponds to the steepest gradient axis for peak magnitude values, as depicted in the plot below that shows magnitude versus location along that steepest axis (at an angle below the horizontal line; 0 along the steepest gradient axis corresponds to the location of the circle in the contour plot). For all PDs, there was a significant trend of higher magnitudes for more rostral–ventral locations of the ICC. For longer PDs (656 and 984 μs), this trend was no longer significant (P > 0.05). The color scale of the contour plots corresponds to magnitude values in millivolts (mV). Not all the same locations are used for each plot since different phase durations were used for different sites and animals (see Table 1). The most caudal–dorsal locations are not included because no visible activity was present at 40 dB. This specific level was selected to present one example of how magnitude values change with ICC stimulation location. For more details on how we identified the different ICC locations or calculated the steepest gradient axis, see “Methods”.
FIG. 8
FIG. 8
Evoked potential magnitudes recorded in the primary auditory cortex as a function current level for different stimulation locations in the central nucleus of the inferior colliculus (ICC) and phase durations (PDs) (AE). Some of the caudal locations listed in Table 1 were not included in some of these plots since the elicited evoked potentials were not large enough to accurately measure the peak magnitude though the threshold of activation could still be determined (see legend on each plot). G Data for another series of experiments in which two shanks were simultaneously inserted into the ICC but one within a caudal region and another within the rostral region to ensure two sites within the same best frequency lamina but in different isofrequency locations. Color corresponds to the two different groups we used for analysis. For details on how we grouped the sites, see Methods: “ICC probe histology and site locations”.

Similar articles

Cited by

References

    1. Abeles M, Goldstein MH., Jr Functional architecture in cat primary auditory cortex: columnar organization and organization according to depth. J Neurophysiol. 1970;33:172–187. - PubMed
    1. Bartlett EL, Stark JM, Guillery RW, Smith PH. Comparison of the fine structure of cortical and collicular terminals in the rat medial geniculate body. Neuroscience. 2000;100:811–828. doi: 10.1016/S0306-4522(00)00340-7. - DOI - PubMed
    1. Bierer JA, Middlebrooks JC. Auditory cortical images of cochlear-implant stimuli: dependence on electrode configuration. J Neurophysiol. 2002;87:478–492. - PubMed
    1. Blackburn CC, Sachs MB. The representations of the steady-state vowel sound /e/ in the discharge patterns of cat anteroventral cochlear nucleus neurons. J Neurophysiol. 1990;63:1191–1212. - PubMed
    1. Bledsoe SC, Shore SE, Guitton MJ. Spatial representation of corticofugal input in the inferior colliculus: a multicontact silicon probe approach. Exp Brain Res. 2003;153:530–542. doi: 10.1007/s00221-003-1671-6. - DOI - PubMed

Publication types