

Quality control and quality assurance in genotypic data for genome-wide association studies
- PMID: 20718045
- PMCID: PMC3061487
- DOI: 10.1002/gepi.20516
Quality control and quality assurance in genotypic data for genome-wide association studies
Abstract
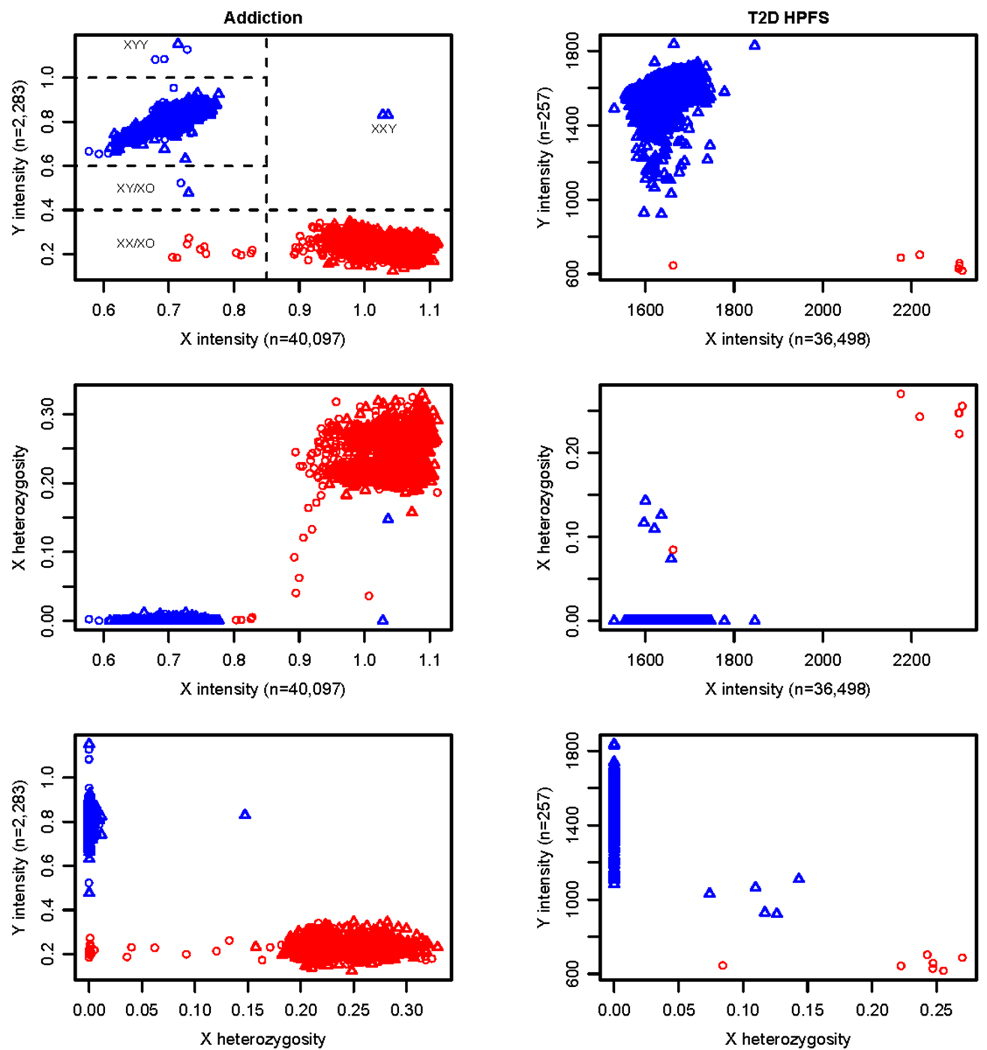
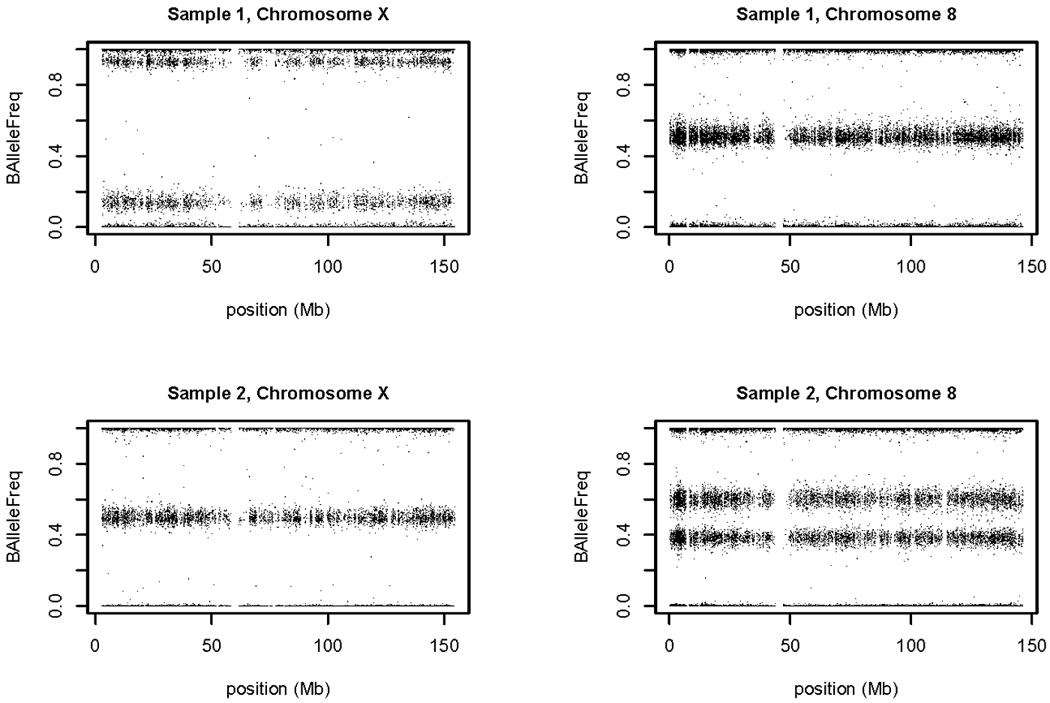
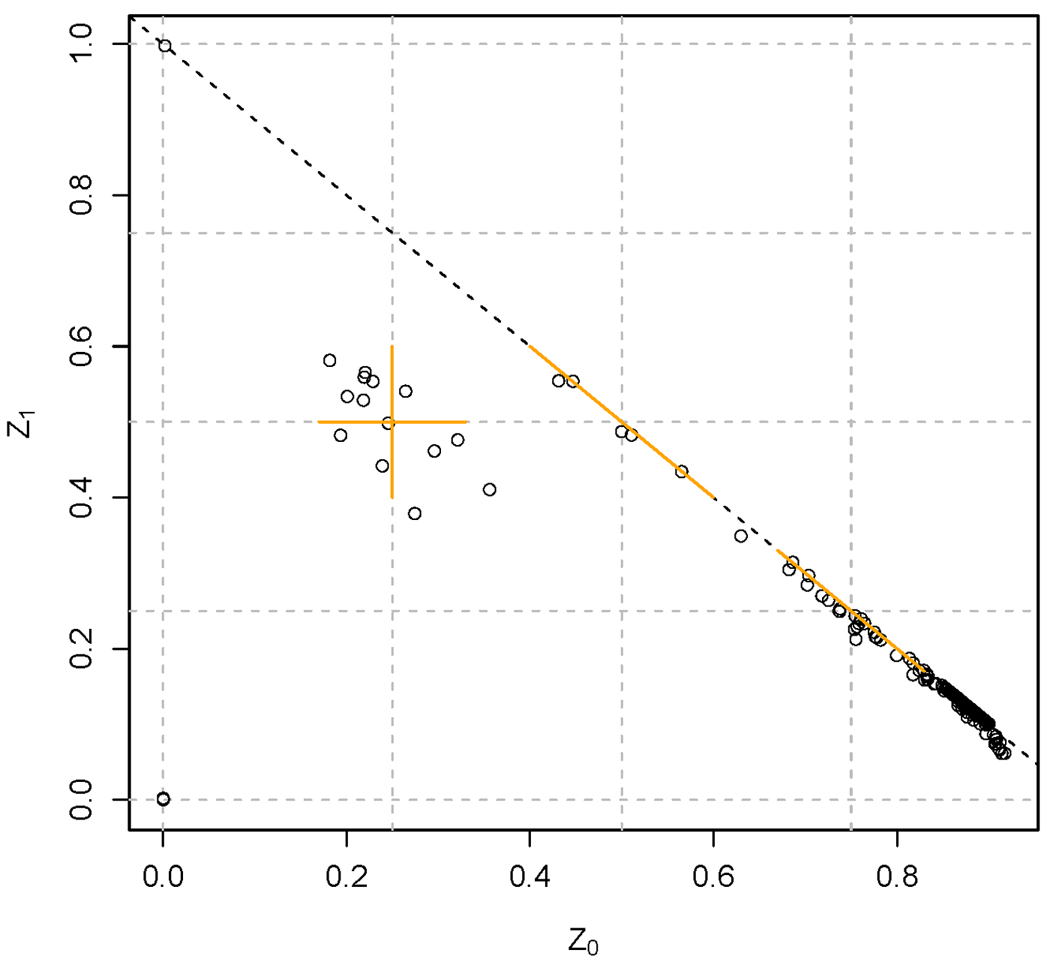
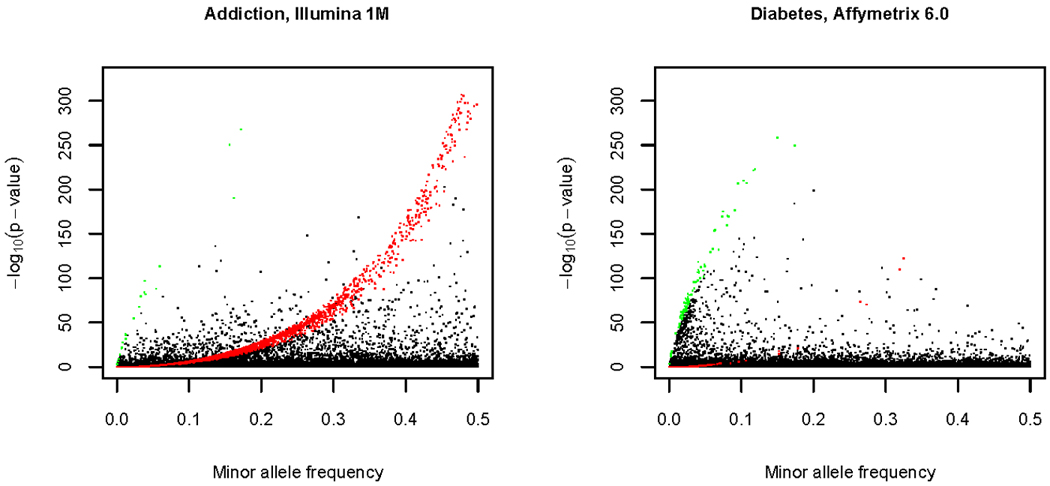
Genome-wide scans of nucleotide variation in human subjects are providing an increasing number of replicated associations with complex disease traits. Most of the variants detected have small effects and, collectively, they account for a small fraction of the total genetic variance. Very large sample sizes are required to identify and validate findings. In this situation, even small sources of systematic or random error can cause spurious results or obscure real effects. The need for careful attention to data quality has been appreciated for some time in this field, and a number of strategies for quality control and quality assurance (QC/QA) have been developed. Here we extend these methods and describe a system of QC/QA for genotypic data in genome-wide association studies (GWAS). This system includes some new approaches that (1) combine analysis of allelic probe intensities and called genotypes to distinguish gender misidentification from sex chromosome aberrations, (2) detect autosomal chromosome aberrations that may affect genotype calling accuracy, (3) infer DNA sample quality from relatedness and allelic intensities, (4) use duplicate concordance to infer SNP quality, (5) detect genotyping artifacts from dependence of Hardy-Weinberg equilibrium test P-values on allelic frequency, and (6) demonstrate sensitivity of principal components analysis to SNP selection. The methods are illustrated with examples from the "Gene Environment Association Studies" (GENEVA) program. The results suggest several recommendations for QC/QA in the design and execution of GWAS.
(c) 2010 Wiley-Liss, Inc.
Figures
References
-
- Barrett JC, Cardon LR. Evaluating coverage of genome-wide association studies. Nat Genet. 2006;38(6):659–662. - PubMed
-
- Broman KW. Cleaning genotype data. Genet Epidemiol. 1999;17 Suppl 1:S79–S83. - PubMed
-
- Cardon LR, Palmer LJ. Population stratification and spurious allelic association. Lancet. 2003;361(9357):598–604. - PubMed
-
- Chanock SJ, Manolio T, Boehnke M, Boerwinkle E, Hunter DJ, Thomas G, Hirschhorn JN, Abecasis G, Altshuler D, Bailey-Wilson JE, et al. Replicating genotype-phenotype associations. Nature. 2007;447(7145):655–660. - PubMed
-
- Clayton DG, Walker NM, Smyth DJ, Pask R, Cooper JD, Maier LM, Smink LJ, Lam AC, Ovington NR, Stevens HE, et al. Population structure, differential bias and genomic control in a large-scale, case-control association study. Nat Genet. 2005;37(11):1243–1246. - PubMed
Publication types
MeSH terms
Grants and funding
- U01 HG004438/HG/NHGRI NIH HHS/United States
- P01 CA089392/CA/NCI NIH HHS/United States
- U01HG004422/HG/NHGRI NIH HHS/United States
- R01DA013423/DA/NIDA NIH HHS/United States
- HHSN268200782096C/HG/NHGRI NIH HHS/United States
- ImNIH/Intramural NIH HHS/United States
- U01 DE017018/DE/NIDCR NIH HHS/United States
- U10 AA008401/AA/NIAAA NIH HHS/United States
- U01 HG004399/HG/NHGRI NIH HHS/United States
- P01CA089392/CA/NCI NIH HHS/United States
- U01HG004438/HG/NHGRI NIH HHS/United States
- U10AA008401/AA/NIAAA NIH HHS/United States
- U01 HG004446/HG/NHGRI NIH HHS/United States
- U01 HG004424/HG/NHGRI NIH HHS/United States
- U01HG004399/HG/NHGRI NIH HHS/United States
- U01 HG004422/HG/NHGRI NIH HHS/United States
- U01HG04424/HG/NHGRI NIH HHS/United States
- R01 DA019963/DA/NIDA NIH HHS/United States
- R01 DA013423/DA/NIDA NIH HHS/United States
LinkOut - more resources
Full Text Sources
Other Literature Sources
Molecular Biology Databases
