. 2010 Dec;161(7):1584-98.
doi: 10.1111/j.1476-5381.2010.00987.x.

Pharmacogenetics of the mycophenolic acid targets inosine monophosphate dehydrogenases IMPDH1 and IMPDH2: gene sequence variation and functional genomics

Affiliations

Pharmacogenetics of the mycophenolic acid targets inosine monophosphate dehydrogenases IMPDH1 and IMPDH2: gene sequence variation and functional genomics

T-Y Wu et al. Br J Pharmacol. 2010 Dec.

Abstract

Background and purpose: Inosine monophosphate dehydrogenases, encoded by IMPDH1 and IMPDH2, are targets for the important immunosuppressive drug, mycophenolic acid (MPA). Variation in MPA response may result, in part, from genetic variation in IMPDH1 and IMPDH2.

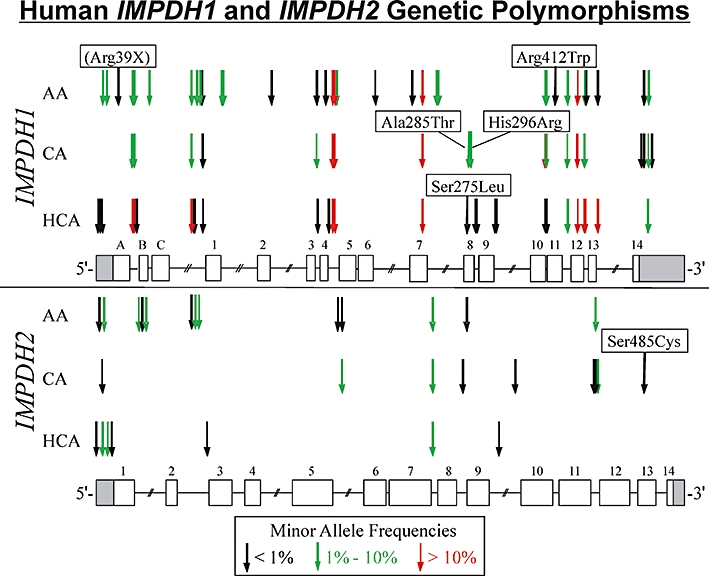
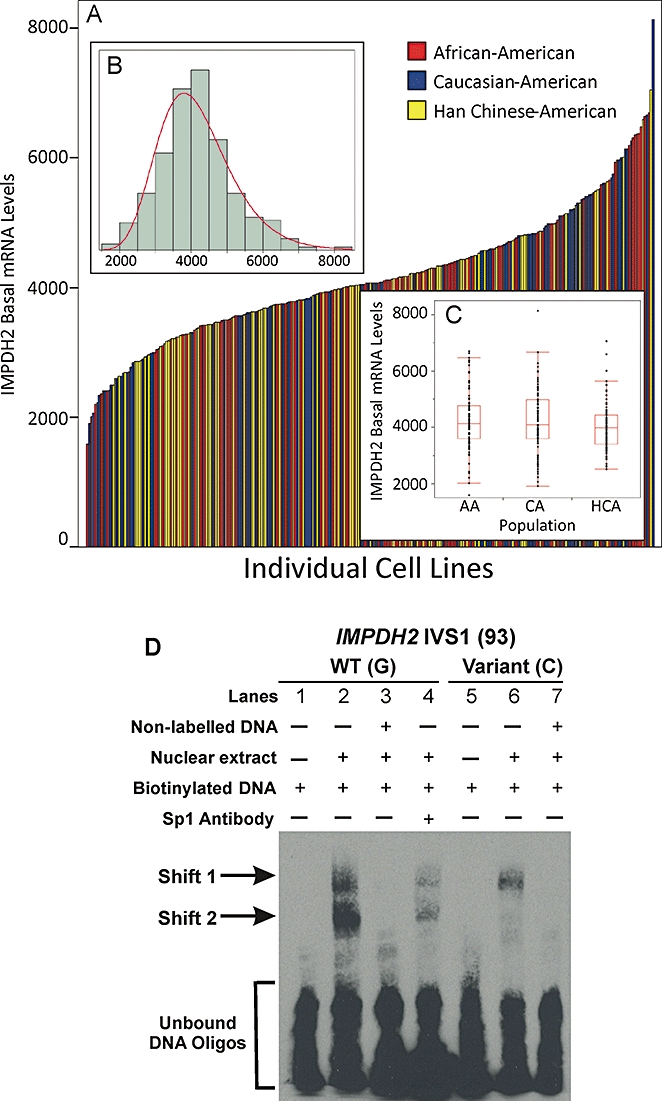
Experimental approach: We resequenced IMPDH1 and IMPDH2 using DNA from 288 individuals from three ethnic groups and performed functional genomic studies of the sequence variants observed.

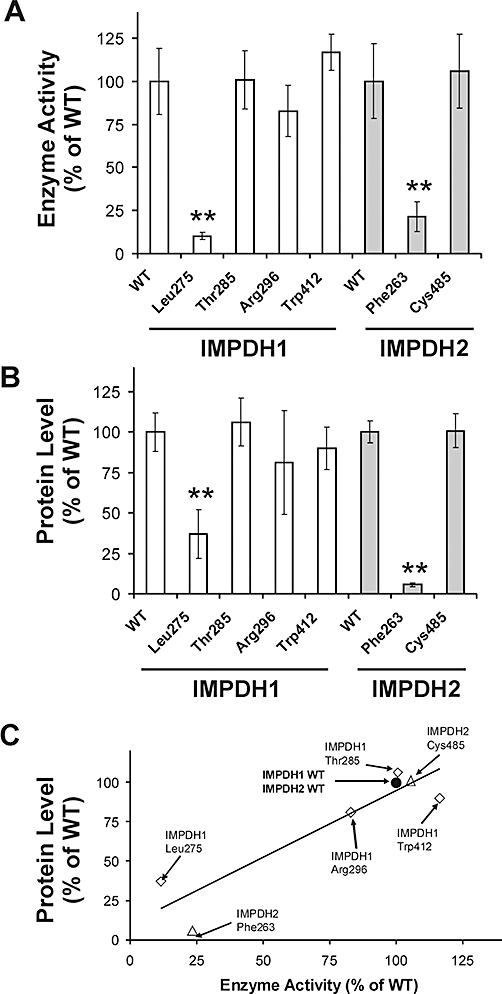
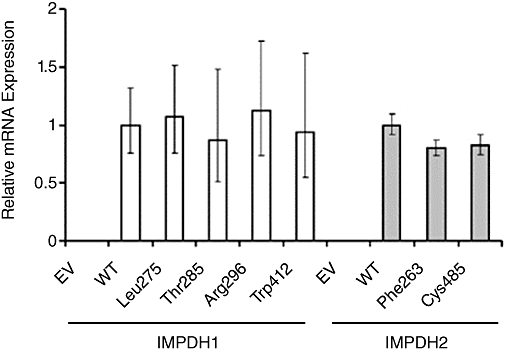
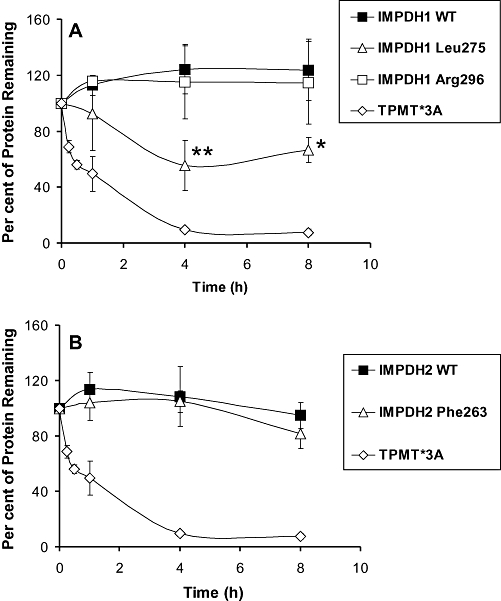
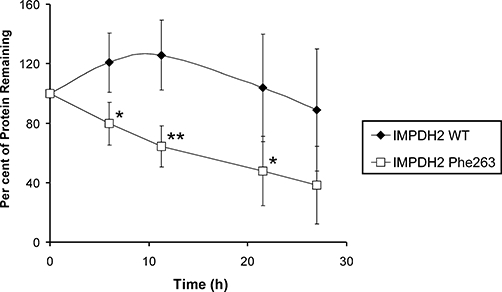
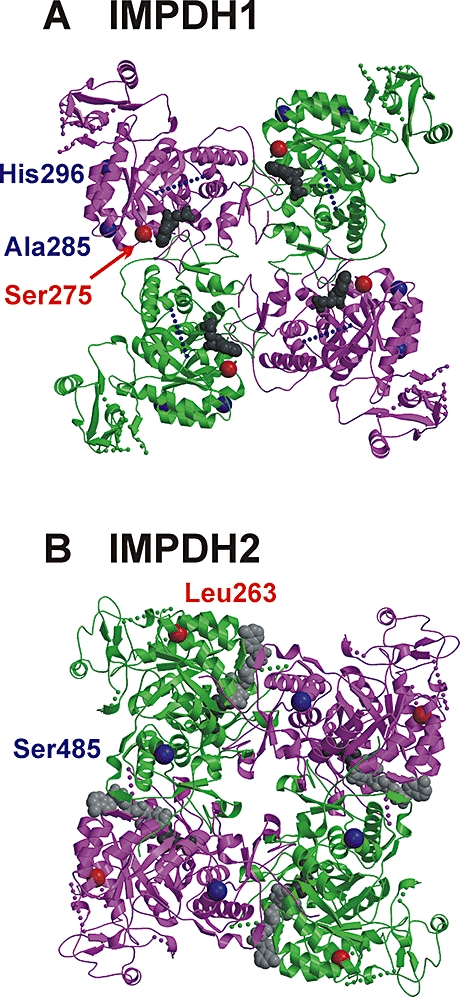
Key results: We identified 73 single nucleotide polymorphisms (SNPs) in IMPDH1, 59 novel, and 25 SNPs, 24 novel, in IMPDH2. One novel IMPDH1 allozyme (Leu275) had 10.2% of the wild-type activity as a result of accelerated protein degradation. Decreased activity of the previously reported IMPDH2 Phe263 allozyme was primarily due to decreased protein quantity, also with accelerated degradation. These observations with regard to the functional implications of variant allozymes were supported by the IMPDH1 and IMPDH2 X-ray crystal structures. A novel IMPDH2 intron 1 SNP, G > C IVS1(93), was associated with decreased mRNA quantity, possibly because of altered transcription.

Conclusions and implications: These results provide insight into the nature and extent of sequence variation in the IMPDH1 and IMPDH2 genes. They also describe the influence of gene sequence variation that alters the encoded amino acids on IMPDH function and provide a foundation for future translational studies designed to correlate sequence variation in these genes with outcomes in patients treated with MPA.


Figures

Figure 1
Figure 1
Human IMPDH1 and IMPDH2 genetic polymorphisms. Open rectangles denote coding exons, and shaded rectangles are untranslated regions. The exons for IMPDH1 are numbered according to Gu et al. (1997), so that translation initiation for the canonical 514 amino acid IMPDH1 isoform begins in exon 1. Exons A, B and C encode N-terminal extensions that are part of longer IMPDH1 isoforms that are translated from an ATG translation initiation codon located in exon A. Arrows indicate the locations of polymorphisms, with frequencies indicated by colours. Nonsynonymous SNPs are indicated, with the appropriate amino acid change. AA, African-American; CA, Caucasian-American; HCA, Han Chinese-American.
Figure 2
Figure 2
Average levels of IMPDH1 and IMPDH2 enzyme activity (A), and average levels of IMPDH1 and IMPDH2 immunoreactive protein levels (B), both expressed relative to values for the WT allozyme of the appropriate IMPDH isoform after the transfection of COS-1 cells. At least six independent experiments were performed for each allozyme, and results are expressed as a % of values for the WT allozyme. Error bars denote one SD. **Values that differ significantly from that of the appropriate WT allozyme at P < 0.0001. (C) Correlation between IMPDH1 and IMPDH2 allozyme enzyme activity and immunoreactive protein levels after expression in COS-1 cells (r = 0.92, P = 0.0011). The correlation coefficient for only IMPDH1 allozymes was r = 0.93 (P = 0.021), while that for only IMPDH2 allozymes was r = 0.99 (P = 0.033).
Figure 3
Figure 3
Average IMPDH1 and IMPDH2 allozyme mRNA expression levels as determined by qRT-PCR using SYBR Green chemistry. mRNA levels of IMPDH1 and IMPDH2 allozymes were measured relative to lacZ (which encodes β-galactosidase) mRNA levels, and were normalized to the appropriate WT mRNA level. Error bars denote 95% confidence intervals. EV denotes empty vector.
Figure 4
Figure 4
IMPDH1 and IMPDH2 rabbit reticulocyte lysate (RRL) degradation studies. Average levels of 35S-labelled recombinant IMPDH1 (A) and IMPDH2 (B) allozyme protein remaining at 1, 4 and 8 h after incubation in an untreated RRL. Each time point represents the mean level of protein remaining relative to the initial protein level for three independent assays. Error bars denote one SD. *Differs from WT at this time point with P < 0.05. **Differs from WT at this time point with P < 0.01. The rapidly degraded TPMT*3A protein (Wang et al., 2003) was included as a positive control.
Figure 5
Figure 5
Pulse-chase assay for IMPDH2 WT and Phe263 allozymes. Recombinant IMPDH2 WT or Phe263 were transiently expressed in COS-1 cells, pulse-labelled with 0.1 mCi·mL−1[35S]-methionine, and chased with media containing excess non-radioactive methionine. Average level of 35S-labelled protein remaining was determined at 6, 11, 21 and 27 h. Each time point represents the mean level of protein remaining relative to the initial protein level for four independent assays. Error bars denote one SD. *Differs from WT at this time point with P < 0.05. **Differs from WT at this time point with P < 0.01.
Figure 6
Figure 6
Variant residues within the IMPDH1 and IMPDH2 structures. (A) The tetrameric crystal structure of IMPDH1 is shown as a ribbon diagram (magenta and green) with five gaps for the missing residues within each monomer drawn as dotted lines. The active site bound inhibitor 6-Cl-IMP (shown as gray space-filling spheres) is accessible from the ‘front’ face. The WT amino acids at variant residues are depicted as red or blue spheres. Specifically, Ser275 (red sphere) is located near the active site and the tetramerization interface, while Ala285 and His296 (blue spheres) are distant from both. Arg412 is located in a gap of 50 disordered residues (blue dotted line), so its location cannot be shown. (B) The tetrameric IMPDH2 crystal structure containing ribavirin monophosphate (dark gray spheres) and C2-mycophenolic adenine dinucleotide (light gray spheres) in each active site is shown. From this ‘back’ view, both Leu263 (red sphere) and Ser485 (blue sphere) are distant from the active site and the tetramerization interface.
Figure 7
Figure 7
Basal IMPDH2 mRNA expression levels in the lymphoblastoid cell lines from which the resequenced DNA was obtained. (A) Variation in IMPDH2 basal mRNA expression levels. Each bar represents an individual cell line, and the height of the bar represents the basal mRNA expression level. Bars are colour-coded by ethnic group. (B) Frequency distribution histogram of IMPDH2 basal mRNA expression levels. (C) IMPDH2 basal mRNA expression did not differ across the three populations studied. AA, African-American; CA, Caucasian-American; HCA, Han Chinese-American. (D) Electrophoretic mobility shift assay blot for IMPDH2 SNP IVS1(93) to investigate potential protein–DNA interactions. Lanes 1–4 contain DNA oligonucleotides with the WT sequence and lanes 5–7 contain DNA oligonucleotides with the variant nucleotide sequence. Lanes 1 and 5 contain no nuclear extract protein and serve as negative controls. Lane 2 shows that DNA oligonucleotides with the WT sequence result in two electrophoretic mobility shifts, ‘Shift 1’ and ‘Shift 2’. Lane 6, which contains DNA oligonucleotides with the variant sequence, shows that the variant sequence cannot bind the protein(s) that result in ‘Shift 2’. Lanes 3 and 7 contain excess non-labelled DNA oligonucleotides to show that the protein–DNA interactions seen in lanes 3 and 6 are specific. Addition of Sp1 antibody did not result in a supershift of either ‘Shift 1’ or ‘Shift 2’, but did attenuate both mobility shifts (lane 4).

References

    1. Allison AC, Eugui EM. Mycophenolate mofetil and its mechanisms of action. Immunopharmacology. 2000;47:85–118. - PubMed
    1. Carr SF, Papp E, Wu JC, Natsumeda Y. Characterization of human type I and type II IMP dehydrogenases. J Biol Chem. 1993;268:27286–27290. - PubMed
    1. Cheung VG, Spielman RS, Ewens KG, Weber TM, Morley M, Burdick JT. Mapping determinants of human gene expression by regional and genome-wide association. Nature. 2005;437:1365–1369. - PMC - PubMed
    1. Emsley P, Cowtan K. Coot: model-building tools for molecular graphics. Acta Crystallogr D Biol Crystallogr. 2004;60:2126–2132. - PubMed
    1. Fernandez A, Martins J, Villlafruela JJ, Marcen R, Pascual J, Cano T, et al. Variability of mycophenolate mofetil trough levels in stable kidney transplant patients. Transplant Proc. 2007;39:2185–2186. - PubMed

Publication types