. 2010 Sep;161(1):33-50.
doi: 10.1111/j.1476-5381.2010.00840.x.

Angiotensin receptor type 1 antagonists protect against neuronal injury induced by oxygen-glucose depletion

Affiliations

Angiotensin receptor type 1 antagonists protect against neuronal injury induced by oxygen-glucose depletion

X Wu et al. Br J Pharmacol. 2010 Sep.

Abstract

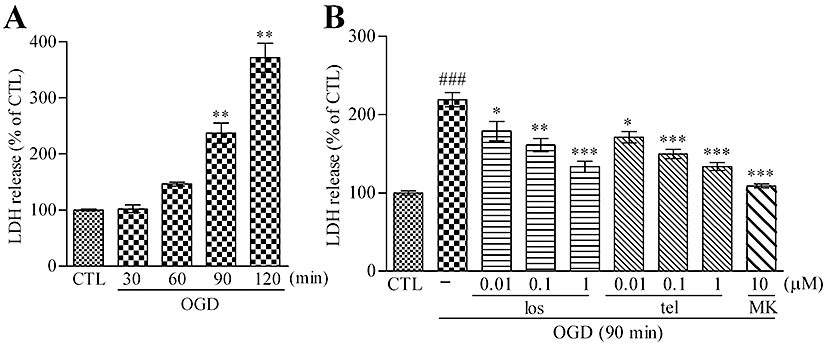
Background and purpose: Several clinical trials and in vivo animal experiments have suggested that blockade of angiotensin receptor type 1 (AT(1)) improves ischaemic outcomes. However, the mechanism(s) underlying these effects has not been elucidated. Here, we have investigated the protective effects of pretreatment with AT(1) receptor antagonists, losartan or telmisartan, against ischaemic insult to neurons in vitro.

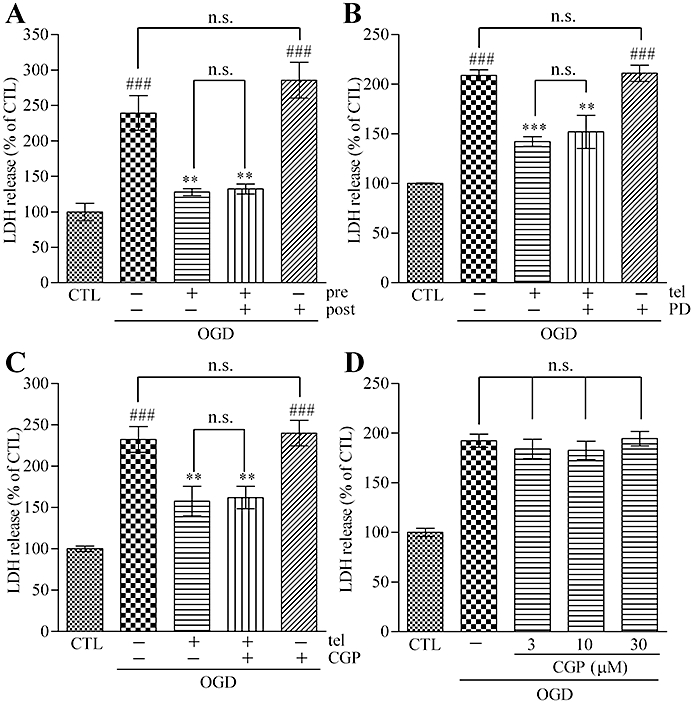
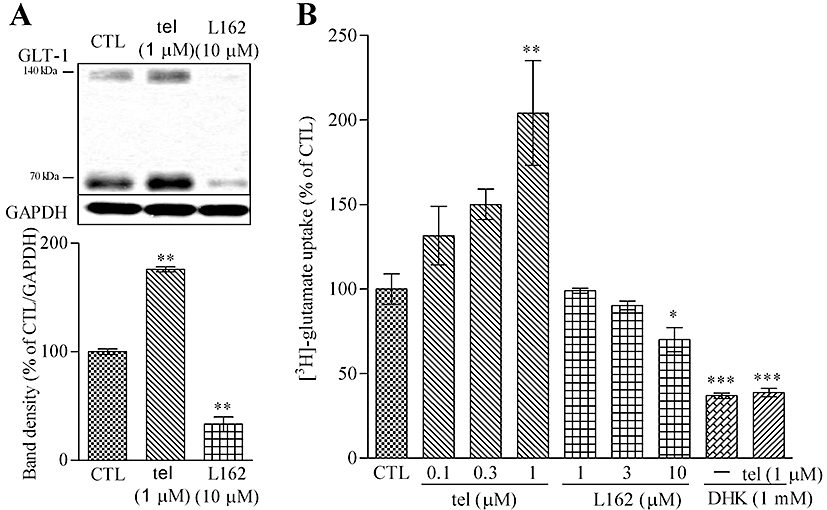
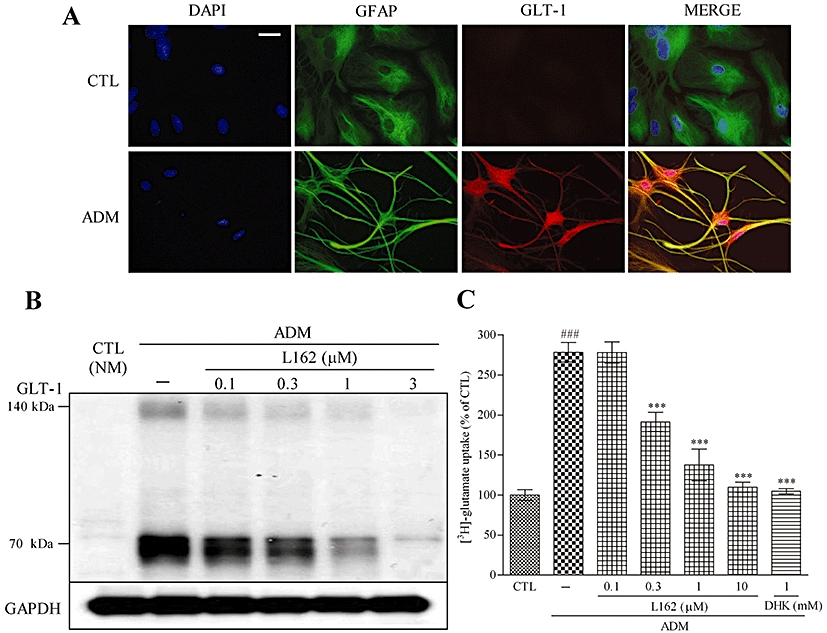
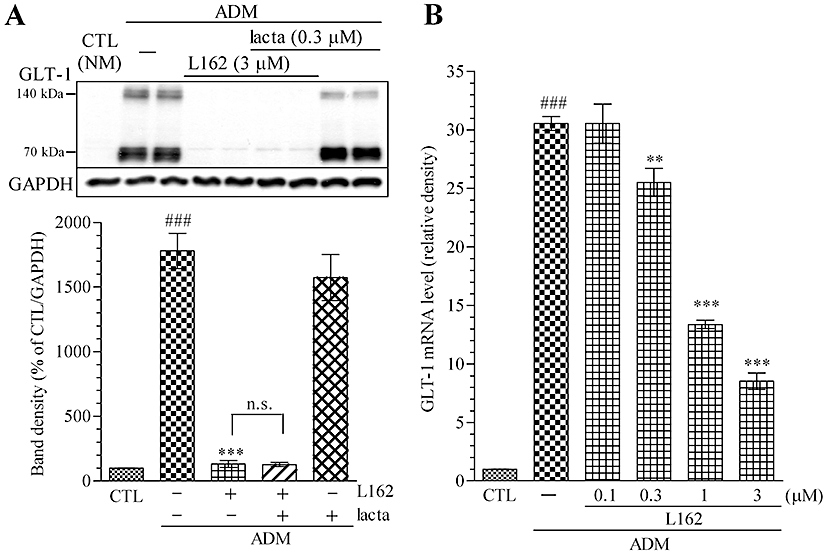
Experimental approach: Primary rat neuron-astrocyte co-cultures and astrocyte-defined medium (ADM)-cultured pure astrocyte cultures were prepared. Ischaemic injury was modelled by oxygen-glucose depletion (OGD) and lactate dehydrogenase release after OGD was measured with or without AT(1) receptor antagonists or agonists (L162313), AT(2) receptor antagonist (PD123319) or agonist (CGP-42112A) pretreatment, for 48 h. Activity of glutamate transporter 1 (GLT-1) was evaluated by [(3)H]-glutamate uptake assays, after AT(1) receptor agonists or antagonists. Immunoblot and real-time PCR were used for analysis of protein and mRNA levels of GLT-1.

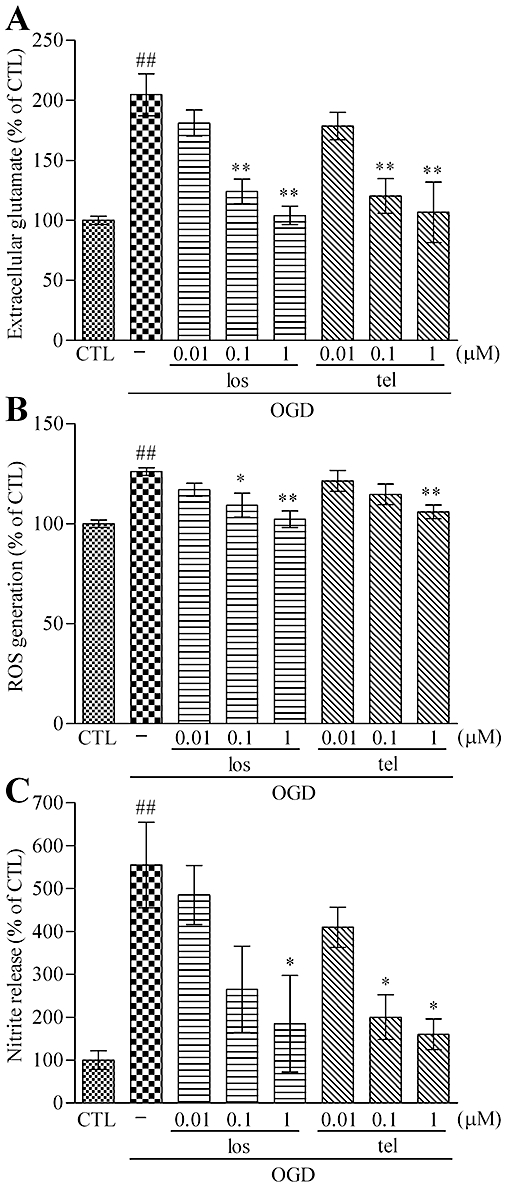
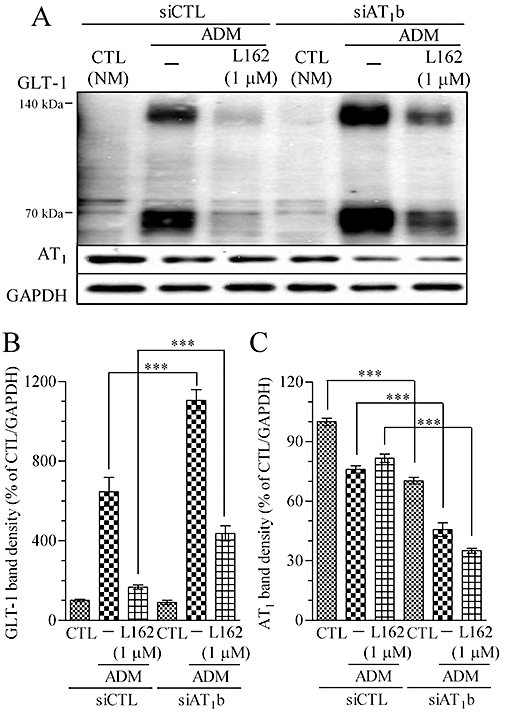
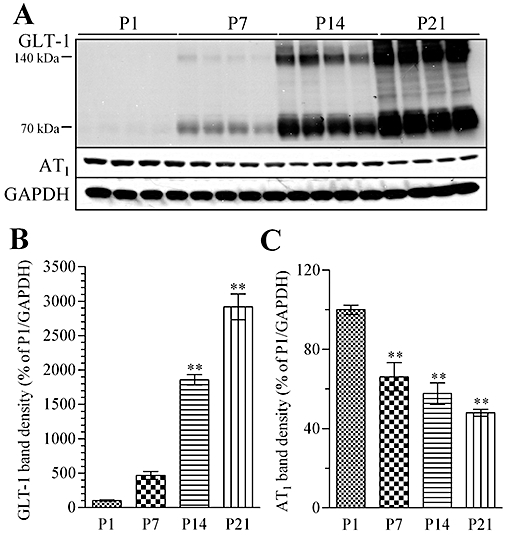
Key results: AT(1) receptor agonists augmented OGD-induced cellular damage, which was attenuated by AT(1) receptor antagonists. AT(1) receptor antagonists also suppressed OGD-induced extracellular glutamate release, reactive oxygen species production and nitric oxide generation. GLT-1 expression and glutamate uptake activity were significantly enhanced by AT(1) receptor antagonists and impaired by AT(1) receptor agonists. AT(1) receptor stimulation suppressed both ADM-induced GLT-1 protein expression and mRNA levels. AT(1)b receptor knock-down with siRNA enhanced GLT-1 expression. In postnatal (P1-P21) rat brains, protein levels of GLT-1 and AT(1) receptors were inversely correlated.

Conclusions and implications: Suppression of AT(1) receptor stimulation induced GLT-1 up-regulation, which ameliorated effects of ischaemic injury.


Figures

Figure 1
Figure 1
AT1 receptor antagonist pretreatment reduces OGD-induced LDH release from neuron–astrocyte co-cultures. (A) OGD injury using the AnaeroPack system induced LDH release from neuron–astrocyte co-cultures in a time-dependent manner. Data represent mean ± SE, n= 6 for each group. **P < 0.01 versus control; anova followed by Dunnett's multiple comparison test. (B) A 48 h pretreatment with the AT1 receptor antagonist, losartan (0.01–1 µM) or telmisartan (0.01–1 µM), reduced LDH release induced by 90 min OGD in a concentration-dependent manner. A 24 h post-treatment of MK801 (10 µM) also reduced the LDH release after 90 min OGD. Data represent mean ± SE, n= 7 for each group. ###P < 0.001 versus control; *P < 0.05, **P < 0.01, ***P < 0.001 versus OGD; anova followed by Newman–Keuls multiple comparison test. los, losartan; tel, telmisartan; MK, MK801.
Figure 2
Figure 2
Pre-blockade of AT1 receptors is essential for the neuroprotective effect of AT1 receptor antagonism against OGD. (A) A 24 h post-treatment with telmisartan (1 µM) did not show neuroprotective effects. A 48 h pretreatment plus 24 h post-treatment with telmisartan (1 µM) did not enhance the neuroprotective effect of 48 h pretreatment of telmisartan (1 µM). (B) Simultaneous 48 h pretreatment of the AT2 receptor antagonist, PD123319 (10 µM), did not abolish the neuroprotective effect of telmisartan (1 µM) against the effects of 90 min OGD. PD123319 (10 µM) alone did not affect the OGD-induced LDH release. (C) A 48 h pretreatment with the AT2 receptor antagonist, CGP-42112A (1 µM), alone did not show neuroprotective effects against 90 min OGD. A simultaneous 48 h pretreatment with CGP-42112A (1 µM) did not enhance the neuroprotective effect of telmisartan (1 µM). (D) Higher concentration treatment of CGP-42112A (3–30 µM) did not exert neuroprotective effects. Data represent mean ± SE, n= 6 for each group. ###P < 0.001 versus control; **P < 0.01, ***P < 0.001 versus OGD; anova followed by Newman–Keuls multiple comparison test. n.s., not significant; tel, telmisartan; PD, PD123319; CGP, CGP-42112A; pre, pretreatment; post, post-treatment.
Figure 3
Figure 3
Pre-stimulation of AT1 receptors augments OGD-induced neuronal cell damage. (A) A 48 h pretreatment with Ang II (100 µM) increased LDH release induced by 90 min OGD, and it was attenuated by simultaneous treatment with telmisartan (1 µM). (B) A 48 h pretreatment with the AT1 receptor agonist, L162313 (10 µM), increased the OGD-induced LDH release. Simultaneous treatment with telmisartan (1 µM) decreased L162313 (10 µM)-enhanced OGD-induced LDH release. (C) A 48 h pretreatment with Ang II (100 µM) increased the 90 min OGD-induced LDH release, and it was attenuated by 24 h post-treatment with MK801 (10 µM). (D) A 48 h pretreatment with L162313 (10 µM) increased the OGD-induced LDH release which was significantly decreased by 24 h post-treatment with MK801 (10 µM). Data represent mean ± SE, n= 6 for each group. #P < 0.05; ###P < 0.001 versus control; *P < 0.05, **P < 0.01, ***P < 0.001 versus OGD; $$P < 0.01, $$$P < 0.001 versus OGD plus Ang II (100 µM) or OGD plus L162313 (10 µM); anova followed by Newman–Keuls multiple comparison test. tel, telmisartan; Ang II, angiotensin II; L162, L162313; MK, MK801.
Figure 4
Figure 4
Pretreatment with AT1 receptor antagonist reduces OGD-induced glutamate release, ROS generation and NO release. (A) ODG-induced extracellular glutamate release (from 413 ± 24 nM to 831 ± 122 nM) was reduced by 48 h pretreatment with losartan or telmisartan in a concentration-dependent manner (0.01–1 µM). (B) A 48 h pretreatment with losartan (0.01–1 µM) or telmisartan (0.01–1 µM) reduced the OGD-induced ROS generation in a concentration-dependent manner. (C) OGD-induced NO release (from 267 ± 101 nM to 1480 ± 461 nM) was reduced by 48 h pretreatment with losartan or telmisartan in a concentration-dependent manner (0.01–1 µM). Data represent mean ± SE, n= 3 for each group. ##P < 0.01; ###P < 0.001 versus control; *P < 0.05, **P < 0.01 versus OGD; anova followed by Newman–Keuls multiple comparison test. los, losartan; tel, telmisartan.
Figure 5
Figure 5
GLT-1 expression and glutamate uptake in neuron–astrocyte co-cultures are affected by AT1 receptor antagonism or stimulation. (A) GLT-1 protein level was increased by 48 h treatment with telmisartan (1 µM) and was decreased by L162313 (AT1 receptor agonist, 10 µM). (B) [3H]-glutamate uptake ability was enhanced by 48 h treatment with telmisartan and was reduced by L162313. DHK (GLT-1 inhibitor, 1 mM) significantly reduced telmisartan (1 µM)-induced enhancement of [3H]-glutamate uptake. Data represent mean ± SE, n= 3 for each group. *P < 0.05, **P < 0.01 versus control; anova followed by Dunnett's multiple comparison test. tel, telmisartan; L162, L162313.
Figure 6
Figure 6
L162313 down-regulates GLT-1 expression in ADM-cultured astrocytes. (A) Astrocytes were immunostained with DAPI (blue), anti-GFAP (green) and anti-GLT-1 (red). Four-day incubation with ADM changed the morphology of astrocytes, leading to a highly branched, stellate shape comparison to the typical flat polygonal morphology in CTL (NM). GLT-1 expression was up-regulated according to the GLT-1 (red) immunostain. Scale bar: 30 µm. (B) Simultaneous 4 day treatment with L162313 (AT1 receptor agonist) decreased GLT-1 expression induced by ADM culture. (C) Four-day ADM culture increased the [3H]-glutamate uptake ability. Simultaneous administration with L162313 (0.1–3 µM) attenuated the ADM-enhanced [3H]-glutamate uptake in a concentration-dependent manner. DHK (1 mM) significantly reduced ADM-induced enhancement of [3H]-glutamate uptake. Data represent mean ± SE, n= 3 for each group. ###P < 0.001 versus control; ***P < 0.001 versus ADM; anova followed by Newman–Keuls multiple comparison test. L162, L162313.
Figure 7
Figure 7
L162313 (AT1 receptor agonist) reduces GLT-1 protein expression at a transcriptional level. (A) L162313 treatment decreased GLT-1 expression induced by 4 days of ADM culture. Simultaneous 4 day treatment with the proteasome inhibitor lactacystin (0.3 µM) did not attenuate L162313 (3 µM)-induced GLT-1 down-regulation in ADM-cultured astrocytes. (B) GLT-1 mRNA level was increased by ADM culture (4 days) and was decreased by L162313 (0.1–3 µM) to 8.5 ± 0.7 in a concentration-dependent manner. Data represent mean ± SE, n= 3 for each group. ###P < 0.001 versus control; **P < 0.01, ***P < 0.001 versus ADM; anova followed by Newman–Keuls multiple comparison test. n.s., not significant; lacta, lactacystin; L162, L162313.
Figure 8
Figure 8
RNA interference experiments revealed that AT1 receptors are involved in GLT-1 expression in ADM-cultured astrocytes. (A) Representative immunoblot data of GLT-1, AT1 and GAPDH treated with or without RNA interference for AT1b receptors in astrocytes. (B) Compared with GLT-1 in the control ADM treatment, GLT-1 in siAT1b-treated astrocytes was increased. The diminishing ADM-induced GLT1 up-regulation by L162313 (AT1 receptor agonist, 1 µM) was impaired with mRNA interference for AT1b receptors (from 167.8 ± 10.3 to 436.8 ± 37.4). (C) The AT1 receptor band density was down-regulated in CTL from 100 ± 1.9 to 70.2 ± 1.7, in ADM from 76 ± 1.9 to 45.7 ± 3.4 and in ADM plus L162313 (1 µM) from 81.6 ± 2.1 to 35.1 ± 1.2. Data represent mean ± SE, n= 3 for each group. ***P < 0.001; anova followed by Newman–Keuls multiple comparison test. L162, L162313.
Figure 9
Figure 9
GLT-1 and AT1 receptor levels in rat cortex on postnatal day 1 (P1), P7, P14 and P21. (A) Representative immunoblot data of GLT-1, AT1 receptors and GAPDH of rat cortex at P1, P7, P14 and P21. (B) GLT-1 protein level increased progressively in cortices from P7, P14 and P21 rats (expressed as % of P1). (C) In the same samples, AT1 receptor protein levels decreased progressively in P7, P14 and P21 rats (expressed as % of P1). Data represent mean ± SE, n= 4 for each group. **P < 0.01 versus control; anova followed by Dunnett's multiple comparison test.

Similar articles

Cited by

References

    1. AbdAlla S, Lother H, el Missiry A, Langer A, Sergeev P, el Faramawy Y, et al. Angiotensin II AT2 receptor oligomers mediate G-protein dysfunction in an animal model of Alzheimer disease. J Biol Chem. 2009a;284:6554–6565. - PubMed
    1. AbdAlla S, Lother H, el Missiry A, Sergeev P, Langer A, el Faramawy Y, et al. Dominant negative AT2 receptor oligomers induce G-protein arrest and symptoms of neurodegeneration. J Biol Chem. 2009b;284:6566–6574. - PubMed
    1. Alexander SPH, Mathie A, Peters JA. Guide to Receptors and Channels (GRAC), 4th edn. Br J Pharmacol. 2009;158(Suppl. 1):S1–S254. - PMC - PubMed
    1. Beal M. Mechanisms of excitotoxicity in neurologic diseases. FASEB J. 1992;6:3338–3344. - PubMed
    1. Beart P, O'Shea R. Transporters for l-glutamate: an update on their molecular pharmacology and pathological involvement. Br J Pharmacol. 2007;150:5–17. - PMC - PubMed

MeSH terms