. 2010 Aug 18:10:178.
doi: 10.1186/1471-2229-10-178.

Trichostatin A and 5-azacytidine both cause an increase in global histone H4 acetylation and a decrease in global DNA and H3K9 methylation during mitosis in maize

Affiliations

Trichostatin A and 5-azacytidine both cause an increase in global histone H4 acetylation and a decrease in global DNA and H3K9 methylation during mitosis in maize

Fei Yang et al. BMC Plant Biol. .

Abstract

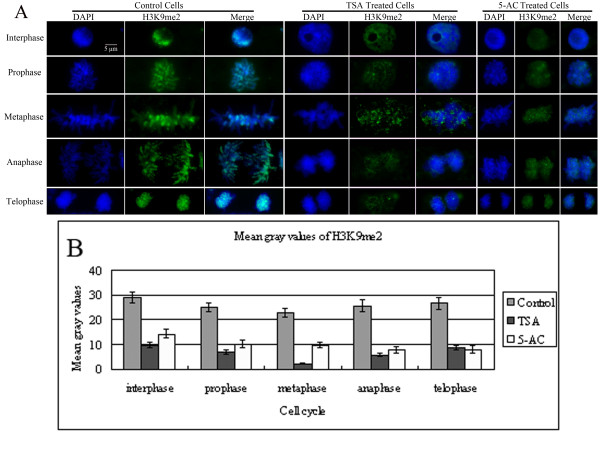
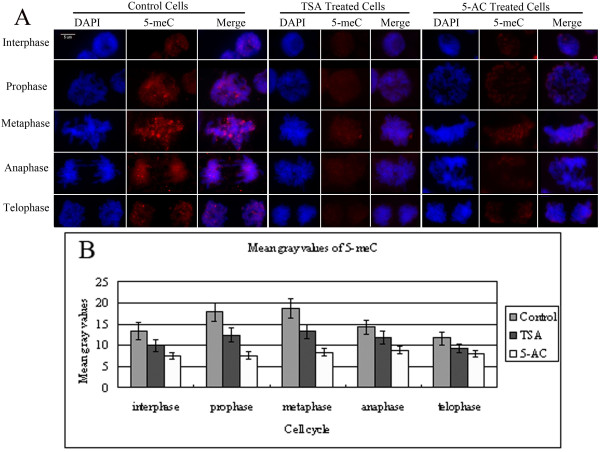
Background: Modifications of DNA and histones in various combinations are correlated with many cellular processes. In this study, we investigated the possible relationship between histone H4 tetraacetylation, DNA methylation and histone H3 dimethylation at lysine 9 during mitosis in maize root meristems.

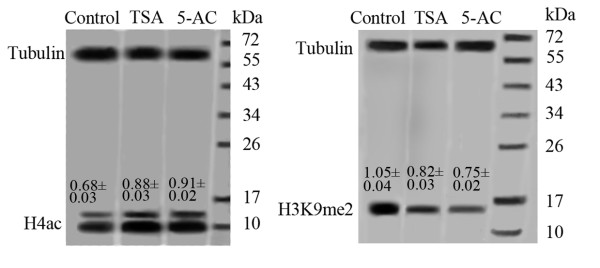
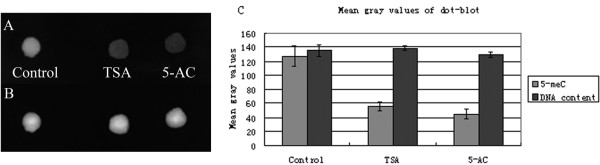
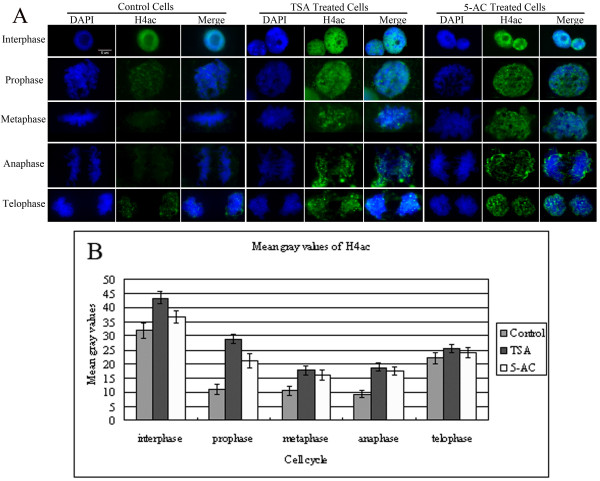
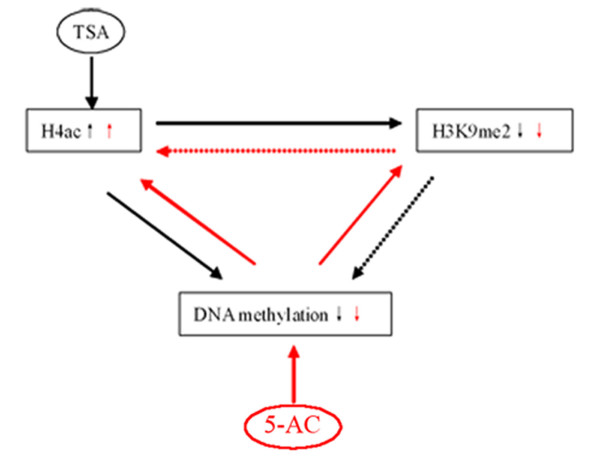
Results: Treatment with trichostatin A, which inhibits histone deacetylases, resulted in increased histone H4 acetylation accompanied by the decondensation of interphase chromatin and a decrease in both global H3K9 dimethylation and DNA methylation during mitosis in maize root tip cells. These observations suggest that histone acetylation may affect DNA and histone methylation during mitosis. Treatment with 5-azacytidine, a cytosine analog that reduces DNA methylation, caused chromatin decondensation and mediated an increase in H4 acetylation, in addition to reduced DNA methylation and H3K9 dimethylation during interphase and mitosis. These results suggest that decreased DNA methylation causes a reduction in H3K9 dimethylation and an increase in H4 acetylation.

Conclusions: The interchangeable effects of 5-azacytidine and trichostatin A on H4 acetylation, DNA methylation and H3K9 dimethylation indicate a mutually reinforcing action between histone acetylation, DNA methylation and histone methylation with respect to chromatin modification. Treatment with trichostatin A and 5-azacytidine treatment caused a decrease in the mitotic index, suggesting that H4 deacetylation and DNA and H3K9 methylation may contain the necessary information for triggering mitosis in maize root tips.


Figures

Figure 1
Figure 1
MNase assay of control and TSA- and 5-AC-treated nuclei. Chromatin from TSA- or 5-AC-treated nuclei after MNase digestion for various amounts of time (in minutes) shows increased sensitivity to MNase compared with chromatin from control nuclei. The left-most lane contains a DNA size marker.
Figure 2
Figure 2
Western blotting for H4ac (11 kDa) and H3K9me2 (17 kDa) in maize root tip cells treated with TSA or 5-AC. Antibodies against tubulin were used as a protein loading control. Representative blots are shown. Average values of abundance index of H4ac and H3K9me2 were indicated in each lane (Mean ± SE). After treatment with either TSA or 5-AC, an increase in global H4ac and a decrease in global H3K9me2 were observed.
Figure 3
Figure 3
Dot-blot for DNA methylation in maize root tip cells treated with TSA or 5-AC. (A) Dot-blot analysis shows that 5-meC decreased in maize root tips after treatment with either 5-AC or TSA. (B) After immunodetection, the same membrane was stained with ethidium bromide to confirm equal DNA loading. (C) Mean gray values of dot-blots shown in (A) and (B). The mean gray value for 5-meC following treatment with either TSA or 5-AC was significantly lower than that of the control, while the mean gray value for DNA content in the control was not significantly different from that of the TSA- or 5-AC-treated sample. Error bars represent standard error of the mean.
Figure 4
Figure 4
Increased levels of H4ac in TSA- and 5-AC-treated cells. (A) Immunostaining of H4ac in representative maize root tip cells in interphase or mitosis after TSA or 5-AC treatment. The 'DAPI' panel shows DAPI-stained DNA images, the 'H4ac' panel shows immunostained images and the 'Merge' panel shows the combined blue and green signals. In control cells, the strongly acetylated histone H4 signal was evenly distributed in the nucleus at interphase, and nucleoli were barely acetylated. At prophase, the deacetylation of H4 is initiated, and very weak acetylation is observed. As the cells progressed into metaphase and early telophase, the acetylated histone H4 signal is almost undetectable, whereas at telophase, H4 begins to be acetylated. In both TSA- and 5-AC-treated cells, strong hyperacetylation of histone H4 was detected in both mitotic and interphase cells of maize root tips compared with control cells. Bar = 5 μm. (B) Histogram showing mean gray values of the immunostaining signals for H4ac shown in (A). The mean gray value for H4ac after treatment with either TSA or 5-AC is higher than in the control. The mean gray values for H4ac were showed in Additional file 1: Table S1. Error bars represent the standard error of the mean.
Figure 5
Figure 5
Reduction in H3K9me2 in TSA- and 5-AC treated cells. (A) Immunostaining for H3K9me2 in representative maize root tip cells in interphase or mitosis after TSA or 5-AC treatment. The 'DAPI' panel shows DAPI-stained DNA images, the 'H3K9me2' panel shows immunostained images and the 'Merge' panel shows a combination of blue and green signals. Dispersed H3K9me2 staining was observed throughout interphase and mitosis in the control cells. All TSA- and 5-AC-treated cells during interphase and mitosis have lower H3K9me2 levels than the untreated control cells. Bar = 5 μm. (B) Histogram showing mean gray values of the immunostaining signals for H3K9me2. The mean gray value for H3K9me2 after treatment with TSA or 5-AC is lower than that of the control. The mean gray values for H3K9me2 were derived from Additional file 1: Table S2. Error bars represent standard error of the mean.
Figure 6
Figure 6
Reduction in 5-meC in TSA- and 5-AC-treated cells. (A) Immunostaining for 5-meC in representative maize root tip cells in interphase or mitosis after TSA or 5-AC treatment. The 'DAPI' panel shows DAPI-stained DNA images, the '5-meC' panel shows immunostained images and the 'Merge' panel shows a combination of blue and green signals. As the untreated control cells progressed into metaphase and early telophase, the amount of 5-meC within mitotic chromosomes increased compared with the amount in interphase cells. The DNA methylation level was reduced in each cell cycle phase after TSA and 5-AC treatments compared with control cells. Bar = 5 μm. (B) Histogram showing mean gray values of the immunostaining signals for 5-meC. The mean gray value of 5-meC signal after treatment with TSA or 5-AC is lower than that of the control. The mean gray values for 5-meC were derived from Additional file 1: Table S3. Error bars represent standard error of the mean.
Figure 7
Figure 7
Model depicting cross-talk between histone H4 acetylation, DNA methylation and H3K9me2. The black arrow shows the TSA-mediated pathway, and the red arrow displays the 5-AC-mediated pathway. TSA induces an increase in H4ac, which subsequently causes a decrease in H3K9me2 and DNA methylation. 5-AC causes a decrease in DNA methylation, which is followed by an increase in H4ac and a decrease in H3K9me2. DNA methylation and H4ac both precede and control H3K9me2, while H4ac and DNA methylation affect each other. H3K9me2 could also feed back on H4 acetylation or/and DNA methylation (dashed red and black arrows).

Similar articles

Cited by

References

    1. Kornberg RD. Chromatin structure: a repeating unit of histones and DNA. Science. 1974;184(139):868–871. doi: 10.1126/science.184.4139.868. - DOI - PubMed
    1. Luger K, Mader AW, Richmond RK, Sargent DF, Richmond TJ. Crystal structure of the nucleosome core particle at 2.8 A resolution. Nature. 1997;389(6648):251–260. doi: 10.1038/38444. - DOI - PubMed
    1. Kouzarides T. Chromatin modifications and their function. Cell. 2007;128(4):693–705. doi: 10.1016/j.cell.2007.02.005. - DOI - PubMed
    1. Berger SL. Gene regulation. Local or global? Nature. 2000;408(6811):412–413. doi: 10.1038/35044160. 415. - DOI - PubMed
    1. Holliday R, Pugh JE. DNA modification mechanisms and gene activity during development. Science. 1975;187(4173):226–232. doi: 10.1126/science.1111098. - DOI - PubMed

Publication types

MeSH terms

LinkOut - more resources