

Inhibition of allogeneic inflammatory responses by the Ribonucleotide Reductase Inhibitors, Didox and Trimidox
- PMID: 20718971
- PMCID: PMC2933664
- DOI: 10.1186/1476-9255-7-43
Inhibition of allogeneic inflammatory responses by the Ribonucleotide Reductase Inhibitors, Didox and Trimidox
Abstract
Background: Graft-versus-host disease is the single most important obstacle facing successful allogeneic stem cell transplantation (SCT). Even with current immunosuppressive therapies, morbidity and mortality rates are high. Current therapies including cyclosporine A (CyA) and related compounds target IL-2 signaling. However, although these compounds offer great benefit, they are also associated with multiple toxicities. Therefore, new compounds with a greater efficacy and reduced toxicity are needed to enable us to overcome this hurdle.
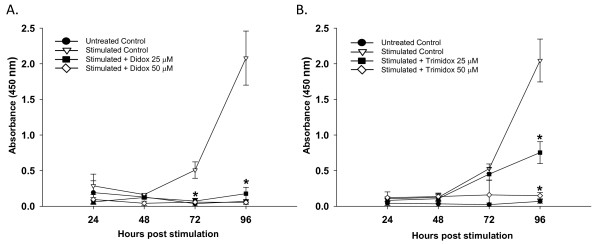
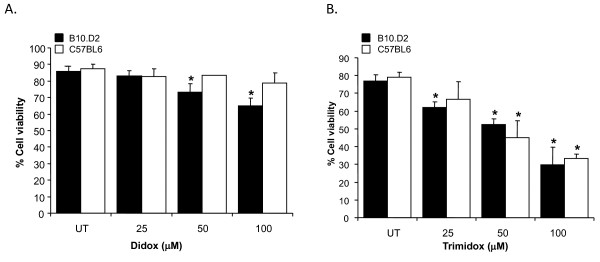
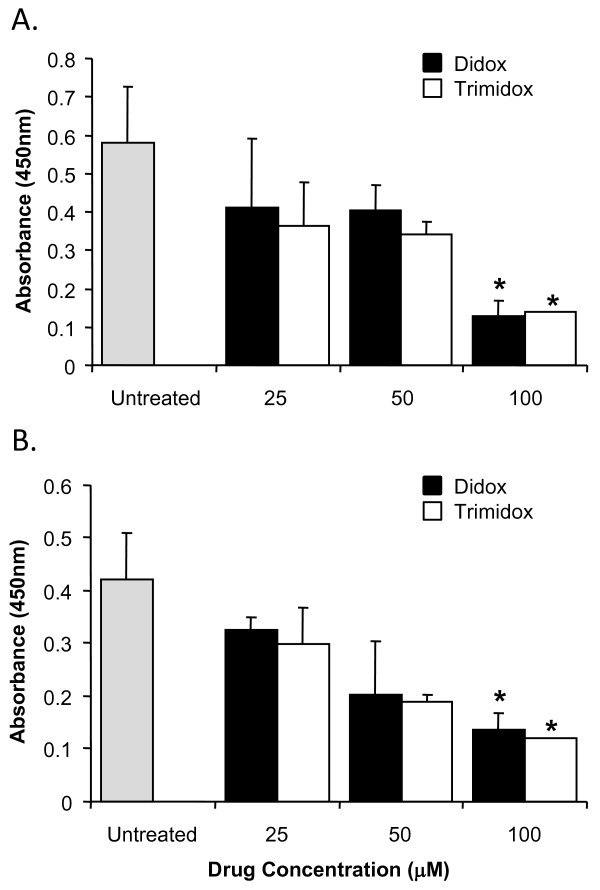
Methods: The allogeneic mixed lymphocyte reaction (MLR) is a unique ex vivo method to study a drug's action on the initial events resulting in T-cell activation and proliferation, synonymous to the initial stages of tissue and organ destruction by T-cell responses in organ rejection and Graft-versus-host disease. Using this approach, we examined the effectiveness of two ribonucleotide reductase inhibitors (RRI), Didox and Trimidox, to inhibit T-cell activation and proliferation.
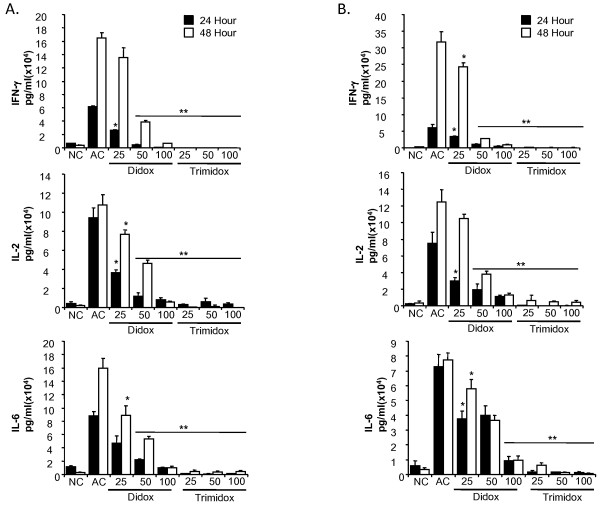
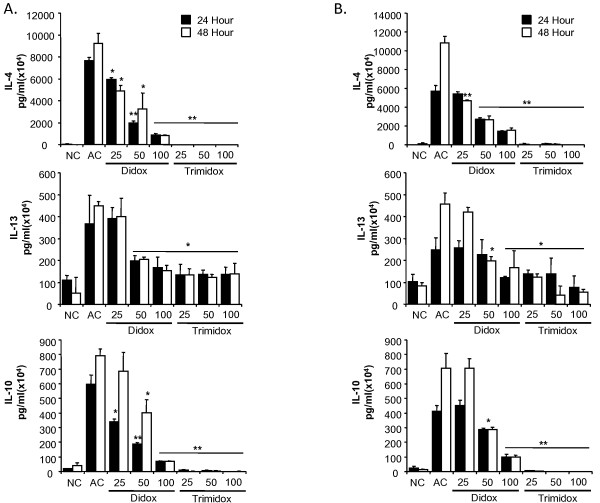
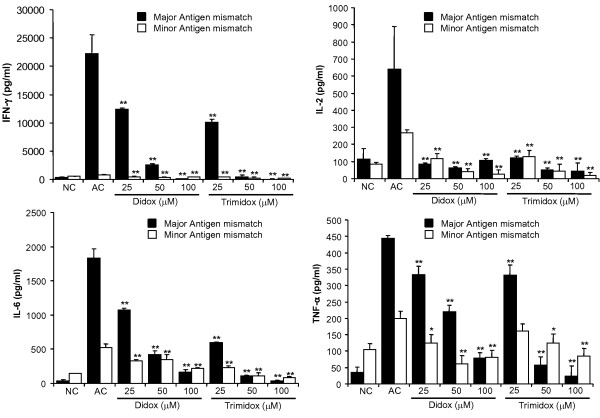
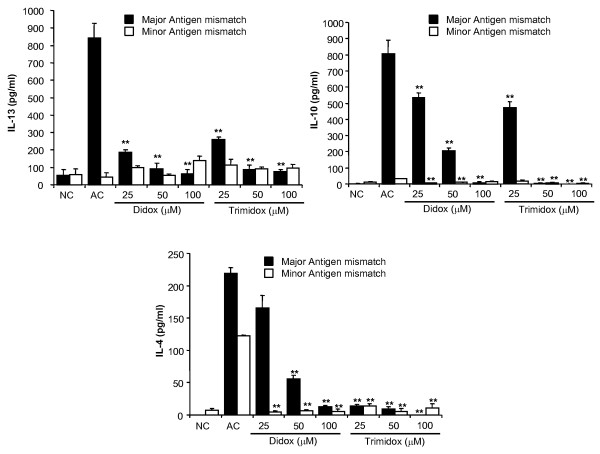
Results: The compounds caused a marked reduction in the proliferative responses of T-cells, which is also accompanied by decreased secretion of cytokines IL-6, IFN-gamma, TNF-alpha, IL-2, IL-13, IL-10 and IL-4.
Conclusions: In conclusion, these data provide critical information to justify further investigation into the potential use of these compounds post allogeneic bone marrow transplantation to alleviate graft-versus-host disease thereby achieving better outcomes.
Figures
Similar articles
-
Enhancement of hemoglobin and F-cell production by targeting growth inhibition and differentiation of K562 cells with ribonucleotide reductase inhibitors (didox and trimidox) in combination with streptozotocin.Am J Hematol. 2000 Apr;63(4):176-83. doi: 10.1002/(sici)1096-8652(200004)63:4<176::aid-ajh3>3.0.co;2-g. Am J Hematol. 2000. PMID: 10706760
-
Allogeneic stem cell transplantation in aggressive B-cell non-Hodgkin lymphoma and in T-cell non-Hodgkin lymphoma: IQWiG Reports – Commission No. N17-02 [Internet].Cologne (Germany): Institute for Quality and Efficiency in Health Care (IQWiG); 2019 Nov 19. Cologne (Germany): Institute for Quality and Efficiency in Health Care (IQWiG); 2019 Nov 19. PMID: 31790167 Free Books & Documents. Review.
-
Hematopoietic stem cell graft manipulation as a mechanism of immunotherapy.Int Immunopharmacol. 2003 Aug;3(8):1121-43. doi: 10.1016/S1567-5769(03)00014-6. Int Immunopharmacol. 2003. PMID: 12860168 Review.
-
Blockade of proliferation and tumor necrosis factor-alpha production occurring during mixed lymphocyte reaction by interferon-gamma-specific natural antibodies contained in intravenous immunoglobulins.Transplantation. 1996 Nov 15;62(9):1292-6. doi: 10.1097/00007890-199611150-00020. Transplantation. 1996. PMID: 8932274
-
Prevention of graft-versus-host disease and bone marrow rejection: kinetics of induction of tolerance by UVB modulation of accessory cells and T cells in the bone marrow inoculum.Blood. 1993 Mar 15;81(6):1658-65. Blood. 1993. PMID: 8453111
Cited by
-
3,4-Dihydroxy-benzohydroxamic acid (Didox) suppresses pro-inflammatory profiles and oxidative stress in TLR4-activated RAW264.7 murine macrophages.Chem Biol Interact. 2015 May 25;233:95-105. doi: 10.1016/j.cbi.2015.03.027. Epub 2015 Apr 2. Chem Biol Interact. 2015. PMID: 25843059 Free PMC article.
-
The efficacy of the ribonucleotide reductase inhibitor Didox in preclinical models of AML.PLoS One. 2014 Nov 17;9(11):e112619. doi: 10.1371/journal.pone.0112619. eCollection 2014. PLoS One. 2014. PMID: 25402485 Free PMC article.
-
Didox (3,4-dihydroxybenzohydroxamic acid) suppresses IgE-mediated mast cell activation through attenuation of NFκB and AP-1 transcription.Cell Immunol. 2017 Dec;322:41-48. doi: 10.1016/j.cellimm.2017.09.008. Epub 2017 Sep 21. Cell Immunol. 2017. PMID: 28964543 Free PMC article.
-
Microglial process convergence on axonal segments in health and disease.Neuroimmunol Neuroinflamm. 2020;7(23):23-39. doi: 10.20517/2347-8659.2019.28. Epub 2020 Mar 21. Neuroimmunol Neuroinflamm. 2020. PMID: 34007863 Free PMC article.
-
Didox (3,4-dihydroxybenzohydroxamic acid) suppresses IL-33-induced cytokine production in primary mouse mast cells.Cell Immunol. 2017 Sep;319:10-16. doi: 10.1016/j.cellimm.2017.04.013. Epub 2017 Jul 11. Cell Immunol. 2017. PMID: 28750923 Free PMC article.
References
-
- Hong JC, Kahan BD. Immunosuppressive agents in organ transplantation: past, present, and future. Seminars in nephrology. 2000;20:108–25. - PubMed
-
- Yarbro JW. Mechanism of action of hydroxyurea. Seminars in oncology. 1992;19:1–10. - PubMed
-
- Kennedy BJ. The evolution of hydroxyurea therapy in chronic myelogenous leukemia. Seminars in oncology. 1992;19:21–6. - PubMed
-
- Kiladjian JJ, Rain JD, Bernard JF, Briere J, Chomienne C, Fenaux P. Long-term incidence of hematological evolution in three French prospective studies of hydroxyurea and pipobroman in polycythemia vera and essential thrombocythemia. Seminars in thrombosis and hemostasis. 2006;32:417–21. doi: 10.1055/s-2006-942762. - DOI - PubMed
Grants and funding
LinkOut - more resources
Full Text Sources
