. 2010 Dec 15;23(4):335-42.
doi: 10.1016/j.niox.2010.08.003. Epub 2010 Aug 16.

Direct, real-time measurement of shear stress-induced nitric oxide produced from endothelial cells in vitro

Affiliations

Direct, real-time measurement of shear stress-induced nitric oxide produced from endothelial cells in vitro

Allison M Andrews et al. Nitric Oxide. .

Abstract

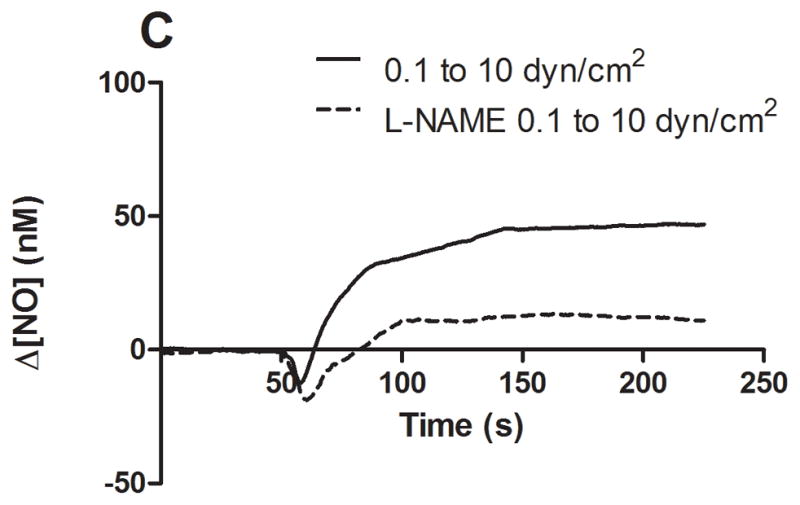
Nitric oxide (NO) produced by the endothelium is involved in the regulation of vascular tone. Decreased NO production or availability has been linked to endothelial dysfunction in hypercholesterolemia and hypertension. Shear stress-induced NO release is a well-established phenomenon, yet the cellular mechanisms of this response are not completely understood. Experimental limitations have hindered direct, real-time measurements of NO under flow conditions. We have overcome these challenges with a new design for a parallel-plate flow chamber. The chamber consists of two compartments, separated by a Transwell® membrane, which isolates a NO recording electrode located in the upper compartment from flow effects. Endothelial cells are grown on the bottom of the membrane, which is inserted into the chamber flush with the upper plate. We demonstrate for the first time direct real-time NO measurements from endothelial cells with controlled variations in shear stress. Step changes in shear stress from 0.1 dyn/cm(2) to 6, 10, or 20 dyn/cm(2) elicited a transient decrease in NO followed by an increase to a new steady state. An analysis of NO transport suggests that the initial decrease is due to the increased removal rate by convection as flow increases. Furthermore, the rate at which the NO concentration approaches the new steady state is related to the time-dependent cellular response rather than transport limitations of the measurement configuration. Our design offers a method for studying the kinetics of the signaling mechanisms linking NO production with shear stress as well as pathological conditions involving changes in NO production or availability.


Figures

Figure 1
Figure 1
Schematic of the flow chamber used for NO measurements. A) The endothelial cells are grown on the bottom of polyester Transwell® inserts (24 mm diameter, 3 μm pores, thickness 10 μm, 4.67 cm2 area) and then inserted into the chamber flush with the upper plate. The electrode, which is located in the upper compartment, is lowered until resting on the Transwell® membrane. Fluid is pumped through the lower compartment to produce laminar flow at desired shear stresses at the cell surface. The chamber is enclosed in a water bath at 37°C to ensure constant temperature during the experiments. A temperature probe is also located in the upper compartment to monitor the temperature during the experiment. B) Close up of the cell-membrane-electrode interface. (Not to scale)
Figure 2
Figure 2
Assembly of chamber parts. The flow chamber is constrained by the top and bottom chamber plates and a gasket, which determines the lateral dimension. The Transwell ◟ insert fits into the chamber top flush with the upper plate. The chamber dimensions (in cm) are 4.57 W × 12.19 L × 0.025 H. The electrode and temperature probe are attached to the electrode holder, which fits into the Transwell ◟ insert and lowered using a micrometer until resting gently on the membrane. (Not to scale)
Figure 3
Figure 3
Sample traces of the shear stress-induced NO response. Experiments began at a low flow rate, which corresponds to a shear stress of 0.1 dyn/cm2 that was then increased to higher flow rates corresponding to 1, 6, 10, or 20 dyn/cm2. The steady-state concentration at 0.1 dyn/cm2 was offset to zero in order to show the individual NO response due to the step change. Responses show a transient decrease in NO concentration following a step change (applied at 50s), followed by an increase to a steady-state value above the initial baseline except for a step change from 0.1 to 1 dyn/cm2, which reached a steady-state value below the initial baseline. The magnitude of the transient decrease in NO concentration following a step change was shear stress dependent.
Figure 4
Figure 4
Analysis of the NO response curves in response to shear stress changes. Experiments started at a low shear stress of 0.1 dyn/cm2, which was then increased by a step change to 1, 6, 10, or 20 dyn/cm2. A) Changes in the steady-state value were calculated based on the difference between the steady-state concentrations before and after a step change. The steady state change at 20 dyn/cm2 was statistically different from both the change observed in response to 6 or 10 dyn/cm2 but was not statistically significant between 6 and 10 dyn/cm2. The steady-state change from 0.1 to 1 dyn/cm2 was statistically different from step changes to all the other shear stresses. Concentration changes ranged from −21–9nM, 19–53nM, 20–47nM, and 24 to 62nM for a step change to 1, 6, 10, and 20 dyn/cm2 respectively. B) To characterize the time course of NO concentration following a step change, concentration profiles were fitted with an exponential curve and time constants (tc) were calculated. Exponential curves did not accurately reflect the time courses for a step change from 0.1 to 1 dyn/cm2. (Mean and SE were plotted and statistics were calculated using the paired two-tailed t-test n= 8 for 1, 6 and 10 dyn/cm2 and n=6 for 20 dyn/cm2, *p<0.05. For time constants, one value for 6 dyn/cm2 and for 10 dyn/cm2 were significant outliers and were excluded using Grubb’s test, α=0.05)
Figure 4
Figure 4
Analysis of the NO response curves in response to shear stress changes. Experiments started at a low shear stress of 0.1 dyn/cm2, which was then increased by a step change to 1, 6, 10, or 20 dyn/cm2. A) Changes in the steady-state value were calculated based on the difference between the steady-state concentrations before and after a step change. The steady state change at 20 dyn/cm2 was statistically different from both the change observed in response to 6 or 10 dyn/cm2 but was not statistically significant between 6 and 10 dyn/cm2. The steady-state change from 0.1 to 1 dyn/cm2 was statistically different from step changes to all the other shear stresses. Concentration changes ranged from −21–9nM, 19–53nM, 20–47nM, and 24 to 62nM for a step change to 1, 6, 10, and 20 dyn/cm2 respectively. B) To characterize the time course of NO concentration following a step change, concentration profiles were fitted with an exponential curve and time constants (tc) were calculated. Exponential curves did not accurately reflect the time courses for a step change from 0.1 to 1 dyn/cm2. (Mean and SE were plotted and statistics were calculated using the paired two-tailed t-test n= 8 for 1, 6 and 10 dyn/cm2 and n=6 for 20 dyn/cm2, *p<0.05. For time constants, one value for 6 dyn/cm2 and for 10 dyn/cm2 were significant outliers and were excluded using Grubb’s test, α=0.05)
Figure 5
Figure 5
Sample traces of the shear stress-induced NO response before and after treatment with 1mM L-NAME (pH 7.2). The steady-state concentration at 0.1 dyn/cm2 was offset to zero in order to show the individual NO response due to the step change occurring at 50s. The solid line represents the NO response prior to L-NAME treatment and the dotted line represents the NO response after L-NAME treatment. A) Sample response from a step change from 0.1 to 1 dyn/cm2. B) Sample response from a step change from 0.1 to 6 dyn/cm2. C) Sample response to a step change from 0.1 to 10 dyn/cm2. D) Sample response to a step change from 0.1 to 20 dyn/cm2.
Figure 5
Figure 5
Sample traces of the shear stress-induced NO response before and after treatment with 1mM L-NAME (pH 7.2). The steady-state concentration at 0.1 dyn/cm2 was offset to zero in order to show the individual NO response due to the step change occurring at 50s. The solid line represents the NO response prior to L-NAME treatment and the dotted line represents the NO response after L-NAME treatment. A) Sample response from a step change from 0.1 to 1 dyn/cm2. B) Sample response from a step change from 0.1 to 6 dyn/cm2. C) Sample response to a step change from 0.1 to 10 dyn/cm2. D) Sample response to a step change from 0.1 to 20 dyn/cm2.
Figure 6
Figure 6
Comparisons of the steady-state NO concentration changes in response to a step change before and after treatment with L-NAME. These changes were calculated between steady-state concentrations before and after application of a step change in shear stress. Comparison of the steady state changes between untreated and L-NAME treated responses were found to be statistically significant between step changes from 0.1 to 6, 10 and 20 dyn/cm2 but not for 0.1 to 1 dyn/cm2 (Mean and SE were plotted, n=8 for 6 and 10 dyn/cm2, n=6 for 20 dyn/cm2 * p<0.05; ** p<0.01; for paired one-tailed t-test). Steady-state changes after treatment with L-NAME averaged 60% of the untreated values. One value for 6 dyn/cm2 was a significant outlier and was excluded using Grubb’s test α=0.01).
Figure 7
Figure 7
Steady-state [NO] v. RNO. At steady state, the concentration of NO is proportional to the production rate for a given shear rate. This relationship for each of the shear stress values used in our study is indicated by the solid lines. If the baseline concentration (at 0.1 dyn/cm2) is known or can be estimated, then the measured change in [NO] can be related to the change in production rate. By fitting an expression for the shear-stress dependent production of NO to the measured changes in [NO] in response to a range of shear stress steps, we were able to estimate the basal production rate. The symbols represent the [NO] and RNO values determined by the best fit hyperbolic function relating RNO to shear stress. Note that for a change in shear stress from 0.1 to 1 dyn/cm2, there is an increase in production, yet the concentration decreases owing to the increased convective washout. This phenomenon was also described in our previously published model [24].
Figure 8
Figure 8
A. Comparison of experimental results for changes in shear stress (open bars, mean ± SE) with steady state ΔNO predicted from 3 different models for shear stress-dependent rate of NO production (RNO(τ): linear = black bars, hyperbolic = gray bars, sigmoidal = hatched bars). B. NO production rate (left axis) and corresponding NO release rate (right axis) as function of shear stress (τ) with best fit parameters for each model. Calculated RNO and release rates for experimental shear stresses are shown for the hyperbolic model (gray squares). Insert: detail at low τ < 1 dyn/cm2.
Figure 8
Figure 8
A. Comparison of experimental results for changes in shear stress (open bars, mean ± SE) with steady state ΔNO predicted from 3 different models for shear stress-dependent rate of NO production (RNO(τ): linear = black bars, hyperbolic = gray bars, sigmoidal = hatched bars). B. NO production rate (left axis) and corresponding NO release rate (right axis) as function of shear stress (τ) with best fit parameters for each model. Calculated RNO and release rates for experimental shear stresses are shown for the hyperbolic model (gray squares). Insert: detail at low τ < 1 dyn/cm2.
Figure 9
Figure 9
Comparison of experimental results and mathematical simulations. Measured NO (solid line) depicts NO concentration as a result of a step change (at 50s) from 0.1 to 20 dyn/cm2. Note the initial decrease in NO concentration followed by an increase to an elevated steady-state concentration. Two mathematical simulations are shown utilizing either a time-dependent (ramp) (dashed line) or time-independent (instantaneous step) relationship (dotted line) between NO production and shear stress. Simulations were performed for a shear stress change from 0.1 dyn/cm2 to 20 dyn/cm2, which occurred at 50s. The time-independent model demonstrated that following a step change a steady-state concentration was reached almost instantaneously. The time-dependent model utilized a linearly increasing production rate in response to the initiation of shear stress. This produced an initial decrease in NO concentration in response to the step change followed by an increase until a new steady-state concentration was reached.

References

    1. Buga GM, Gold ME, Fukuto JM, Ignarro LJ. Shear-stress induced release of nitricoxide from endothelial-cells grown on beads. Hypertension. 1991;17:187–193. - PubMed
    1. Radomski MW, Palmer RM, Moncada S. Endogenous nitric oxide inhibits human platelet adhesion to vascular endothelium. Lancet. 1987;2:1057–8. - PubMed
    1. Radomski MW, Vallance P, Whitley G, Foxwell N, Moncada S. Platelet adhesion to human vascular endothelium is modulated by constitutive and cytokine induced nitric oxide. Cardiovasc Res. 1993;27:1380–2. - PubMed
    1. Garg UC, Hassid A. Nitric oxide-generating vasodilators and 8-bromo-cyclic guanosine monophosphate inhibit mitogenesis and proliferation of cultured rat vascular smooth muscle cells. J Clin Invest. 1989;83:1774–7. - PMC - PubMed
    1. Kubes P, Suzuki M, Granger DN. Nitric oxide: an endogenous modulator of leukocyte adhesion. Proc Natl Acad Sci U S A. 1991;88:4651–5. - PMC - PubMed

Publication types

LinkOut - more resources