. 2010 Nov;51(11):3377-88.
doi: 10.1194/jlr.D008391. Epub 2010 Aug 17.

Comprehensive analysis of the major lipid classes in sebum by rapid resolution high-performance liquid chromatography and electrospray mass spectrometry

Affiliations

Comprehensive analysis of the major lipid classes in sebum by rapid resolution high-performance liquid chromatography and electrospray mass spectrometry

Emanuela Camera et al. J Lipid Res. 2010 Nov.

Abstract

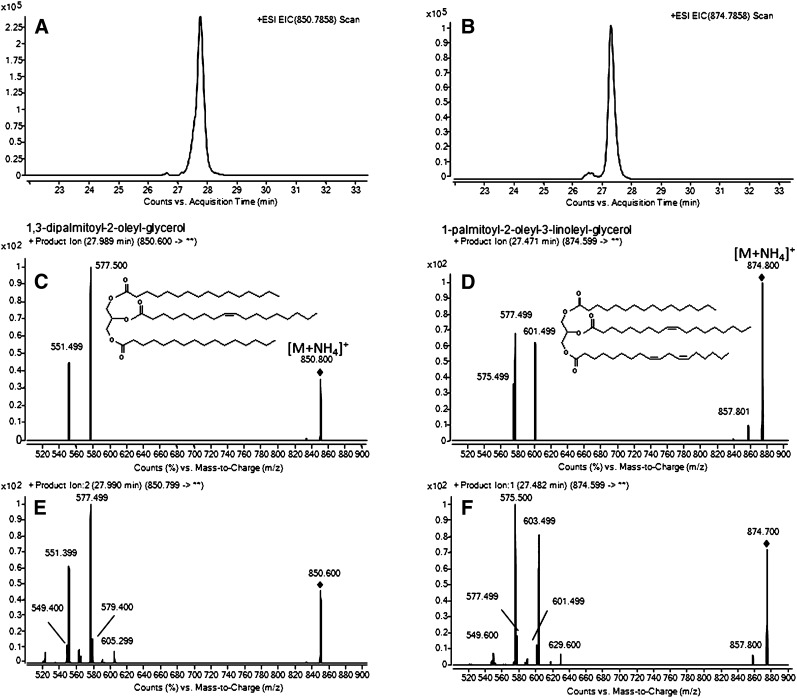
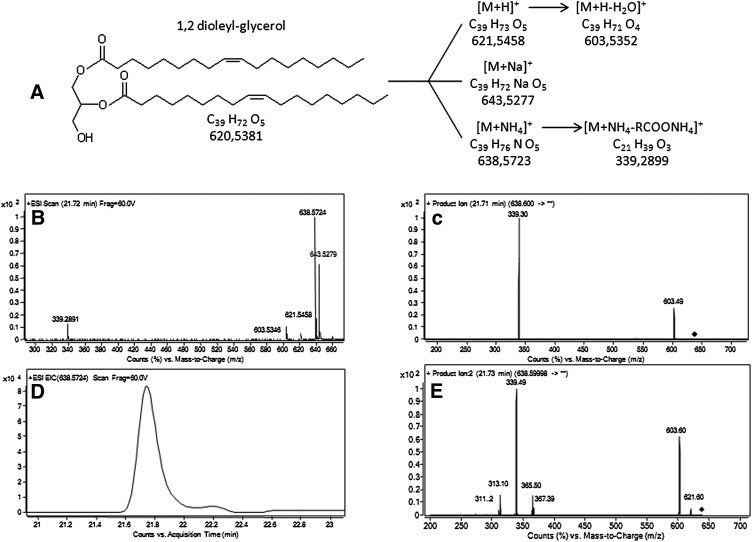
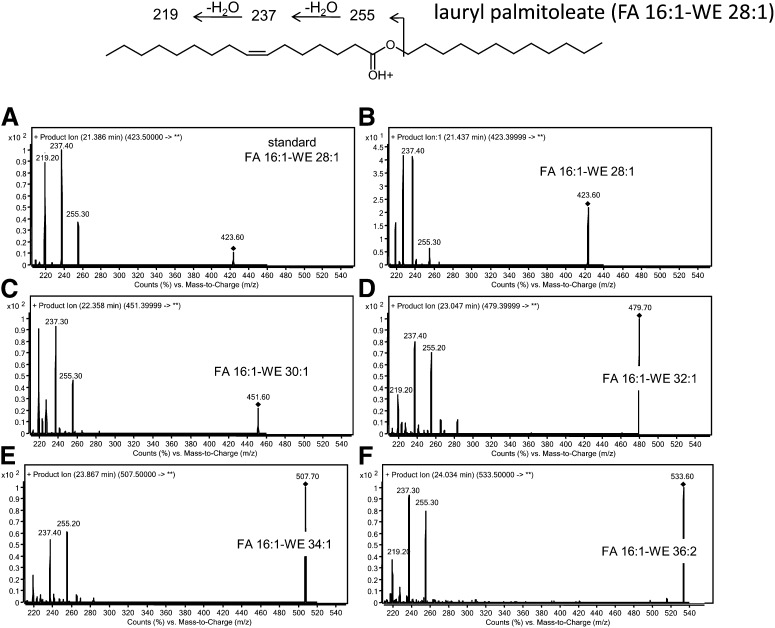
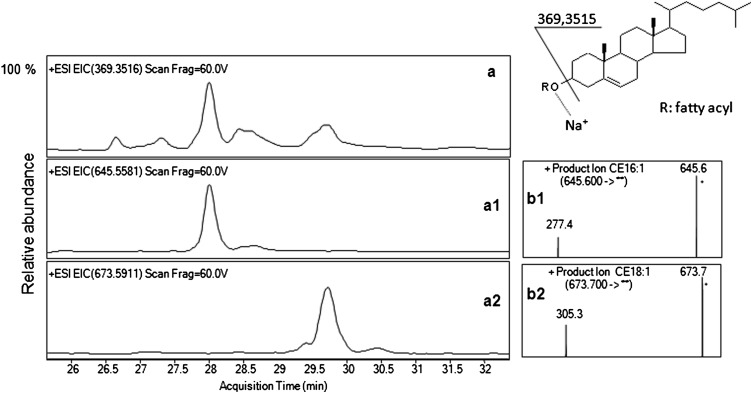
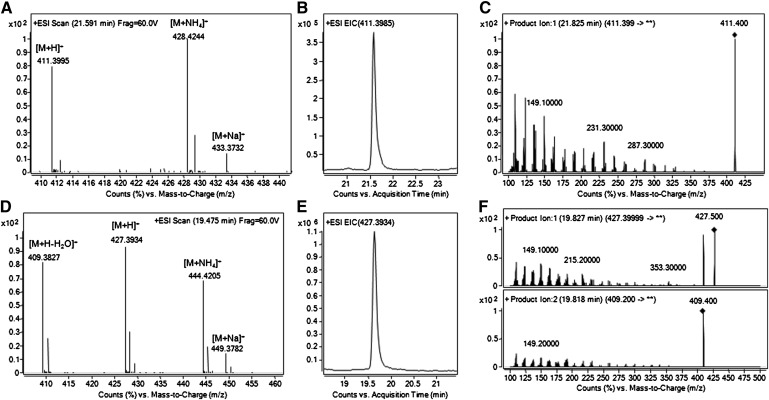
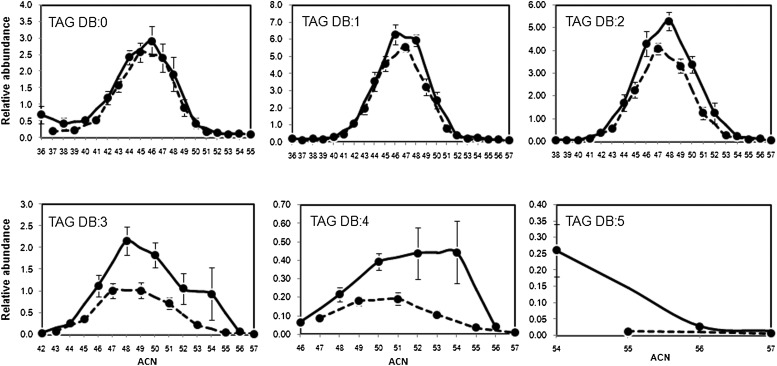
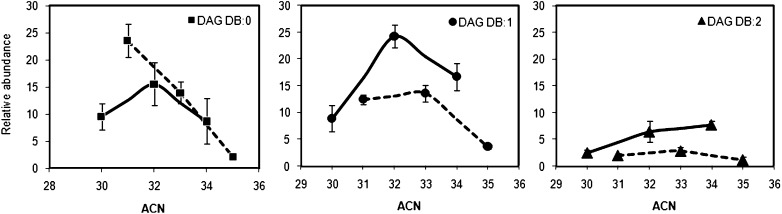
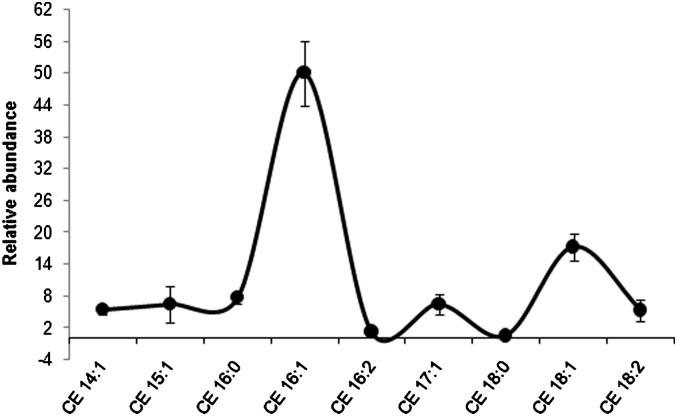
Sebum is a complex lipid mixture that is synthesized in sebaceous glands and excreted on the skin surface. The purpose of this study was the comprehensive detection of the intact lipids that compose sebum. These lipids exist as a broad range of chemical structures and concentrations. Sebum was collected with SebuTape(TM) from the foreheads of healthy donors, and then separated by HPLC on a C8 stationary phase with sub 2 µm particle size. This HPLC method provided high resolution and excellent reproducibility of retention times (RT). Compound mining was performed with time of flight (TOF) and triple quadrupole (QqQ) mass spectrometers (MS), which allowed for the classification of lipids according to their elemental composition, degree of unsaturation, and MS/MS fragmentation. The combination of the two MS systems detected 95 and 29 families of triacylglycerols (TAG) and diacylglycerols (DAG), respectively. Assignment was carried out regardless of positional isomerism. Among the wax esters (WE), 28 species were found to contain the 16:1 fatty acyl moiety. This method was suitable for the simultaneous detection of squalene and its oxygenated derivative. A total of 9 cholesterol esters (CE) were identified and more than 48 free fatty acids (FFA) were detected in normal sebum. The relative abundance of each individual lipid within its own chemical class was determined for 12 healthy donors. In summary, this method provided the first characterization of the features and distribution of intact components of the sebum lipidome.


Figures

Fig. 1.
Fig. 1.
EIC of [M+NH4]+ of TAG 50:1 (A) and TAG 52:3 (B) following RR-RP-HPLC separation of pooled sebum and +ESI/TOF-MS detection. PI scan spectra of the standard TAG 50:1 (1,3-dipalmitoyl-2-oleyl-glycerol) (C) and TAG 52:3 (1-palmitoyl-2-oleyl-3-linoleyl-glycerol) (D) following RR-RP-HPLC separation and +ESI MS/MS detection (10 µM each, structure in insert); PI scan spectra of TAG 50:1 (E) and TAG 52:3 (F) in sebum following RR-RP-HPLC separation and +ESI MS/MS detection. PI scan spectra of standard and sebaceous TAG were achieved with the collision energy and fragmentor voltage set at 18 and 140 V, respectively. EIC, extracted ion chromatogram; PI, product ion; RR-RP-HPLC, rapid resolution reversed-phase HPLC; TAG, triacylglycerol.
Fig. 2.
Fig. 2.
Structure of 1,2 dioleyl-glycerol (DAG 36:2) and ions formed with +ESI (A), +ESI/TOF-MS spectrum (B), and PI scan spectrum (C) of chromatographed standard DAG 36:2. EIC of [M+NH4]+ ion (D) and PI scan spectrum of sebaceous DAG 36:2 following RR-RP-HPLC separation of pooled sebum. PI scans of standard and sebaceous DAG 36:2 were achieved with the collision energy and the fragmentor voltage set at 14 and 140 V, respectively. DAG, diacylglycerol; EIC, extracted ion chromatogram; PI, product ion; RR-RP-HPLC, rapid resolution reversed-phase HPLC; TOF, time of flight.
Fig. 3.
Fig. 3.
Structure and fragmentation pattern of authentic lauryl palmitoleate (FA 16:1-WE 28:1, upper scheme); PI scan spectra of standard lauryl palmitoleate (A) and of the isobaric FA 16:1-WE 28:1 in sebum (B); PI scan spectra of the major FA 16:1-WE identified in sebum (D–G). PI scans of standard and sebaceous WE were achieved with the collision energy and the fragmentor voltage set at 18 and 140 V, respectively. PI, product ion; WE, wax ester.
Fig. 4.
Fig. 4.
Structure and fragmentation scheme of CE (upper right); EIC of total CE (A), CE 16:1 (A1), and CE 18:1 (A2) following RR-RP-HPLC separation and +ESI/TOF-MS detection of pooled sebum; PI scan spectra of CE 16:1 (B1), and CE 18:1 (B2) in sebum separated in the same chromatographic conditions. PI scans of CE were achieved with the collision energy and the fragmentor voltage set at 24 and 140 V, respectively. CE, cholesteryl/cholesterol ester; EIC, extracted ion chromatogram; PI, product ion; RR-RP-HPLC, rapid resolution reversed-phase HPLC; TOF, time of flight.
Fig. 5.
Fig. 5.
+ESI/TOF-MS spectrum (A), EIC of the [M+H]+ ion (B), and PI scan spectrum (C) of squalene following RR-RP-HPLC separation of pooled sebum; +ESI/TOF-MS spectrum (D), and EIC of the [M+H]+ ion (E) of oxygenated squalene. PI scan spectra of oxygenated squalene were obtained by fragmenting the [M+H]+ (F, upper panel) and the [M+H-H2O]+ ions (F, lower panel). In the PI scan mode, the collision energy and the fragmentor voltage were set at 16 and 140 V, respectively. EIC, extracted ion chromatogram; PI, product ion; RR-RP-HPLC, rapid resolution reversed-phase HPLC; TOF, time of flight.
Fig. 6.
Fig. 6.
Relative abundance of TAG within the same lipid class in sebum. TAG were subgrouped by their DB number. Percentage of TAG was plotted against ACN in each subgroup. Data were reported as mean ± SD calculated for the 12 sebum donors. Full and dashed lines represent TAG with an even and an odd ACN, respectively. ACN, acyl carbon number; DB, double bond; TAG, triacylglycerol.
Fig. 7.
Fig. 7.
Relative abundance of DAG within the same lipid class in sebum. DAG were subgrouped by their DB number. Percentage of DAG was plotted against ACN in each DB:0, DB:1, and DB:2 subgroup. Data were reported as mean ± SD calculated for the 12 sebum donors. Full and dashed lines represent DAG with an even and an odd ACN, respectively. ACN, acyl carbon number; DAG, diacylglycerol; DB, double bond.
Fig. 8.
Fig. 8.
Distribution profile of CE detected in sebum. Data represent abundance of individual CE relative to the total CE area and were reported as mean ± SD calculated following RR-RP-HPLC/TOF-MS analysis of sebum from the 12 donors. CE, cholesteryl/cholesterol ester; RR-RP-HPLC, rapid resolution reversed-phase HPLC; TOF, time of flight.

References

    1. Smith K. R., Thiboutot D. M. 2008. Thematic review series: skin lipids. Sebaceous gland lipids: friend or foe? J. Lipid Res. 49: 271–281. - PubMed
    1. Picardo M., Ottaviani M., Camera E., Mastrofrancesco A. 2009. Sebaceous gland lipids. Dermatoendocrinol. 1: 68–71. - PMC - PubMed
    1. Nicolaides N., Ansari M. N., Fu H. C., Lindsay D. G. 1970. Lipid composition on comedones compared with that of human skin surface in acne patients. J. Invest. Dermatol. 54: 487–495. - PubMed
    1. Nicolaides N., Fu H. C., Ansari M. N., Rice G. R. 1972. The fatty acids of wax esters and sterol esters from vernix caseosa and from human skin surface lipid. Lipids. 7: 506–517. - PubMed
    1. Nicolaides N. 1974. Skin lipids: their biochemical uniqueness. Science. 186: 19–26. - PubMed

MeSH terms

LinkOut - more resources