

High-resolution peripheral quantitative computed tomographic imaging of cortical and trabecular bone microarchitecture in patients with type 2 diabetes mellitus
- PMID: 20719835
- PMCID: PMC2968722
- DOI: 10.1210/jc.2010-0226
High-resolution peripheral quantitative computed tomographic imaging of cortical and trabecular bone microarchitecture in patients with type 2 diabetes mellitus
Abstract
Context: Cross-sectional epidemiological studies have found that patients with type 2 diabetes mellitus (T2DM) have a higher incidence of certain fragility fractures despite normal or elevated bone mineral density (BMD).
Objective: In this study, high-resolution peripheral quantitative computed tomography was applied to characterize cortical and trabecular microarchitecture and biomechanics in the peripheral skeleton of female patients with T2DM.
Design and setting: A cross-sectional study was conducted in patients with T2DM recruited from a diabetic outpatient clinic.
Participants: Elderly female patients (age, 62.9 ± 7.7 yr) with a history of T2DM (n = 19) and age- and height-matched controls (n = 19) were recruited.
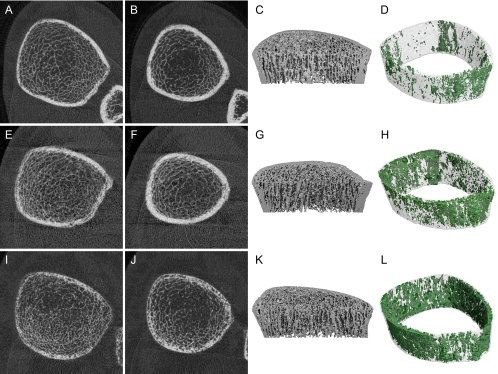
Outcome measures: Subjects were imaged using high-resolution peripheral quantitative computed tomography at the distal radius and tibia. Quantitative measures of volumetric (BMD), cross-sectional geometry, trabecular and cortical microarchitecture were calculated. Additionally, compressive mechanical properties were determined by micro-finite element analysis.
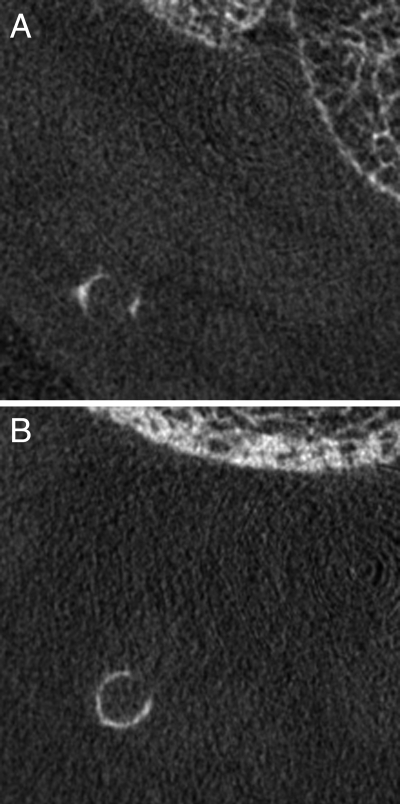
Results: Compared to the controls, the T2DM cohort had 10% higher trabecular volumetric BMD (P < 0.05) adjacent to the cortex and higher trabecular thickness in the tibia (13.8%; P < 0.05). Cortical porosity differences alone were consistent with impaired bone strength and were significant in the radius (>+50%; P < 0.05), whereas pore volume approached significance in the tibia (+118%; P = 0.1).
Conclusion: The results of this pilot investigation provide a potential explanation for the inability of standard BMD measures to explain the elevated fracture incidence in patients with T2DM. The findings suggest that T2DM may be associated with impaired resistance to bending loads due to inefficient redistribution of bone mass, characterized by loss of intracortical bone offset by an elevation in trabecular bone density.
Figures


References
-
- Janghorbani M, Van Dam RM, Willett WC, Hu FB 2007 Systematic review of type 1 and type 2 diabetes mellitus and risk of fracture. Am J Epidemiol 166:495–505 - PubMed
-
- Yamamoto M, Yamaguchi T, Yamauchi M, Kaji H, Sugimoto T 2009 Diabetic patients have an increased risk of vertebral fractures independent of BMD or diabetic complications. J Bone Miner Res 24:702–709 - PubMed
-
- Forsén L, Meyer HE, Midthjell K, Edna TH 1999 Diabetes mellitus and the incidence of hip fracture: results from the Nord-Trondelag Health Survey. Diabetologia 42:920–925 - PubMed
-
- Ottenbacher KJ, Ostir GV, Peek MK, Goodwin JS, Markides KS 2002 Diabetes mellitus as a risk factor for hip fracture in Mexican American older adults. J Gerontol A Biol Sci Med Sci 57:M648–M653 - PubMed
-
- Nicodemus KK, Folsom AR 2001 Type 1 and type 2 diabetes and incident hip fractures in postmenopausal women. Diabetes Care 24:1192–1197 - PubMed
