Comparative Study
. 2010 Oct;104(4):2203-13.
doi: 10.1152/jn.01081.2009. Epub 2010 Aug 18.

Phosphorylation-state-dependent regulation of NMDA receptor short-term plasticity modifies hippocampal dendritic Ca2+ transients

Affiliations
Comparative Study

Phosphorylation-state-dependent regulation of NMDA receptor short-term plasticity modifies hippocampal dendritic Ca2+ transients

Debika Chatterjea et al. J Neurophysiol. 2010 Oct.

Abstract

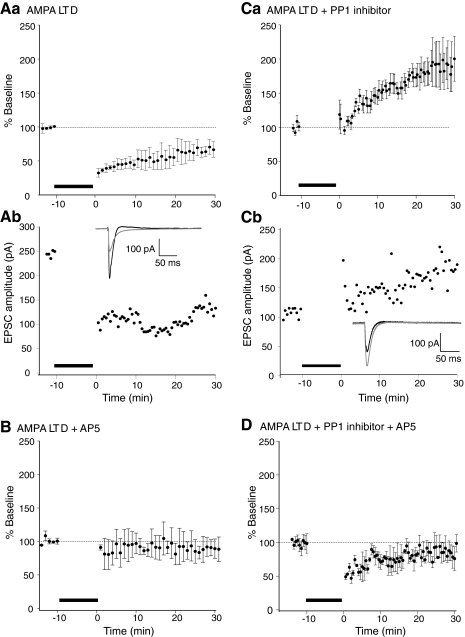
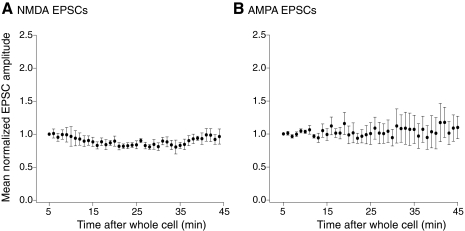
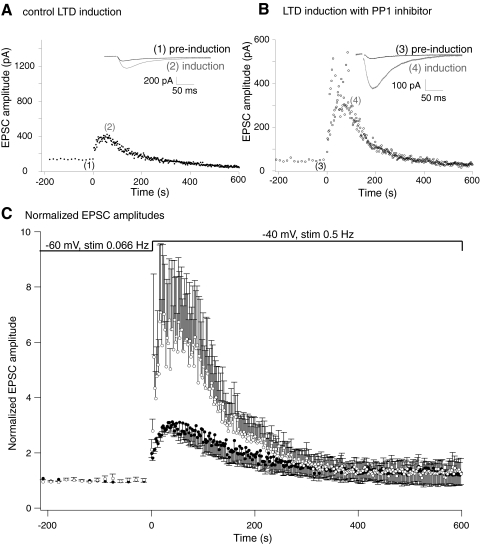
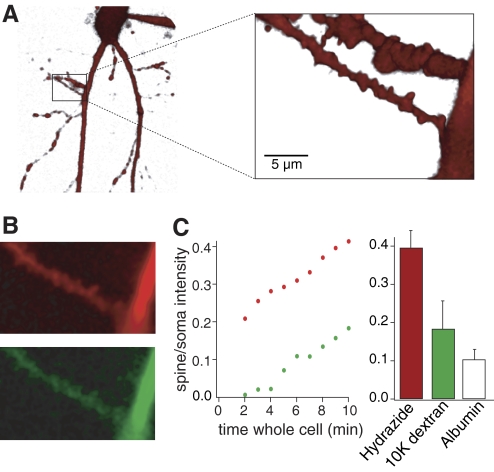
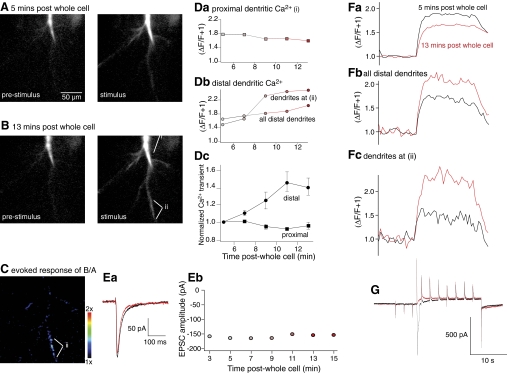
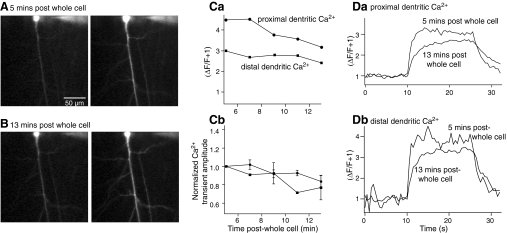
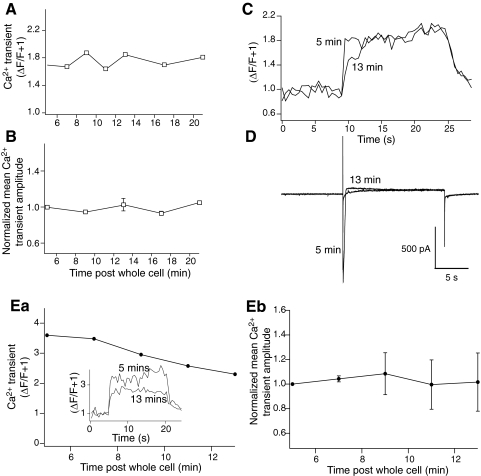
N-methyl-D-aspartate (NMDA) receptor-mediated currents are enhanced by phosphorylation. We have investigated effects of phosphorylation-dependent short-term plasticity of NMDA receptor-mediated excitatory postsynaptic currents (EPSCs) on the induction of long-term depression (LTD). We confirmed in whole cell clamped CA1 pyramidal neurons that LTD is induced by pairing stimulus protocols. However, after serine-threonine phosphorylation was modified by postsynaptic introduction of a protein phosphatase-1 (PP1) inhibitor, the same pairing protocol evoked long-term potentiation (LTP). We determined effects of modification of phosphatase activity on evoked NMDA EPSCs during LTD induction protocols. During LTD induction, using a protocol pairing depolarization to -40 mV and 0.5 Hz stimulation, NMDA receptor-mediated EPSCs undergo a short-term enhancement at the start of the protocol. In neurons in which PP1 activity was inhibited, this short-term enhancement was markedly amplified. We then investigated the effect of this enhancement on Ca(2+) entry during the start of the LTD induction protocol. Enhancement of NMDA receptor-mediated responses was accompanied by an amplification of induction protocol-evoked Ca(2+) transients. Furthermore, this amplification required synaptic activation during the protocol, consistent with an enhancement of Ca(2+) entry mediated by NMDA receptor activation. The sign of NMDA receptor-mediated long-term plasticity, whether potentiation or depression depends on the amplitude of the synaptic Ca(2+) transient during induction. We conclude that short-term phosphorylation-dependent plasticity of the NMDA receptor-mediated EPSCs contributes significantly to the effect of phosphatase inhibition on the subsequent induction of LTD or LTP.


Figures

Fig. 1.
Fig. 1.
Postsynaptic protein phosphatase-1 (PP1) inhibition results in an AMPA long-term potentiation (LTP) in response to long-term depression (LTD)-inducing stimulation. Aa: LTD induced by a 10 min pairing protocol. The holding potential was stepped to –40 mV while the Schaffer collateral commissural pathway (SCCP) was stimulated at 0.5 Hz. The bar denotes the induction period. Pooled data from 5 neurons are shown. Following LTD-inducing stimulus, excitatory postsynaptic current (EPSC) amplitudes were significantly depressed (to 67 ± 10% of baseline 30 min after induction). Ab: example recording from 1 cell. Inset: traces are shown from before LTD induction and after 30 min postinduction. B: this LTD is N-methyl-d-aspartate (NMDA) receptor-dependent. The experiments were repeated in d-2-amino-5-phosphonopentanoic acid (d-AP5; 50 μM). No depression was evoked by induction protocols identical to Aa. Pooled data from 5 neurons are shown. Ca: protein phosphatase inhibitor 2 was included in the patch pipette. Following the LTD-inducing stimulus, postsynaptic PP1 inhibition results in an AMPA LTP in response to an LTD-inducing stimulus. Currents significantly potentiate to 183 ± 28% of baseline. Pooled data from 5 neurons. Cb: an example recording and inset traces (black, before; gray, 30 min after pairing) are shown. D: this LTD protocol induced potentiation is NMDA receptor-dependent. The experiments were repeated in d-AP5 (50 μM). A short-term depression was evoked by induction protocols identical to Aa and Ca. Pooled data from 4 neurons is shown.
Fig. 2.
Fig. 2.
Both AMPA and NMDA receptor-mediated EPSCs remain stable in amplitude in neurons recorded with pipettes containing inhibitor 2. A: mean NMDA receptor-mediated EPSC amplitudes (n = 4) normalized to the amplitude of the 1st minute of recording after whole cell access with pipettes containing inhibitor 2. The superfusate contained 6-cyano-7-nitroquinoxalene-2,3-dione (CNQX, 5 μM) and bicuculline (5 μM). B: mean AMPA receptor-mediated EPSC amplitudes (n = 5) normalized as in the preceding text recorded with pipettes containing inhibitor 2 (100 nM).
Fig. 3.
Fig. 3.
Short-term plasticity of NMDA receptor-mediated EPSCs during LTD induction. Pharmacologically isolated NMDA receptor-mediated EPSCs were recorded before and during the LTD induction protocol. A: graph of NMDA EPSC amplitude. Responses were recorded at 15 s intervals at –60 mV prior to the induction protocol. The membrane potential was then stepped to –40 mV and responses recorded at 2 s intervals. Inset: traces are example EPSCs from the preinduction recording (1, at –60 mV) and at the peak of the EPSC amplitude during the induction protocol (2, at –40 mV). B: neuron recorded under the same conditions as (A) but the PP1 inhibitor peptide was included in the whole cell patch solution. Note that in A and B, the initial amplitude of the EPSC was not the same (this varied from 50 to 120 pA across all recordings). Therefore the graph y axes are adjusted to give approximately comparative initial scaling. C: normalized recordings from 5 cells under control conditions (●) and 5 cells in which the PP1 inhibitor peptide was included in the whole cell patch solution (○). EPSC amplitudes were normalized to preinduction amplitudes during stimulation at –60 mV. Inhibition of PP1 significantly enhances the short-term potentiation of the NMDA receptor-mediated EPSC.
Fig. 4.
Fig. 4.
Diffusion rates from the whole cell pipette to CA1 pyramidal neuron dendritic spines. A: live CA1 pyramidal cell visualized with Alexa 594 hydrazine (MW 520) introduced into the cell through a patch pipette. Box magnified to reveal dendrites and dendritic spines. B: single optical sections imaging Alexa 594 hydrazine and Oregon Green 488 dextran 3000. Top: dendrite (red) with Alexa 594 10 min following whole cell access. Bottom: same dendrite (green) with Oregon Green 488, (3000 MW dextran) again at 10 min after whole cell access. C: graph showing fluorescence rise of the 2 dyes at spines recorded in B plotted against time after whole cell access. Data are normalized (spine intensity/soma intensity). Red, Alexa 594; green, Oregon Green. Histograms show the relative intensity of Alexa 594 hydrazide (red), Oregon Green dextran (green) and fluorescently labeled albumin (MW 66,000; white) introduced in a further 3 neurons, between the soma and dendritic spines, 10 min after obtaining whole cell access.
Fig. 5.
Fig. 5.
Postsynaptic application of inhibitor 2 caused an enhancement of LTD stimulus protocol evoked Ca2+ entry. Neurons were held under whole cell voltage clamp with pipettes containing the Ca2+ sensitive dye, Oregon Green bis-(o-aminophenoxy)-N,N,N′,N′-tetraacetic acid (BAPTA) 1 and Inhibitor 2 (100 nm). A: single optical section confocal image of this dye obtained 5 min after obtaining whole cell access. Left: image is at rest immediately prior to the stimulus. Right: image is from the last image frame obtained during application of a truncated LTD induction protocol in which synaptic stimulation (0.5 Hz) was applied during a voltage step lasting for 20 s (electrophysiological response in G). B: images obtained as for A in the same neuron but after 13 min of whole cell access. C: after subtracting background data and subthreshold masking of data (see methods), stimulus evoked images in B was divided by that in A. This emphasizes that stimulus evoked fluorescence transients were nonuniformly enhanced in the 8 min between recordings in A and B. D: peak amplitude of stimulus evoked fluorescence transients measured in the dendrites for time points from 5 to 13 min after obtaining whole cell access. Da: measurements from the proximal dendritic region i in B. Db: measurements were from the region identified as ii in B and C where a substantial increase in fluorescence was seen and from all dendrites excluding the primary dendrite i in B. Dc: normalized change in amplitude of evoked fluorescence transients over time after whole cell access in all cells in which inhibitor 2 was included in the whole cell pipette. E: amplitude of the stimulus evoked synaptic responses recorded immediately before the step protocol from 3 to 15 min after obtaining whole cell access. Ea: traces obtained from cell in A–D from 3 and 15 min post whole cell. Eb: peak amplitudes of EPSCs recorded throughout this period. F: traces showing fluorescence transients comparing responses from stimuli 5 min post whole cell access (black) to 13 min after obtaining access (red). Fa: from proximal dendrites i in B. Fb: all distal dendrites. Fc: distal dendrites labeled ii in B. The response was markedly enhanced over time in the distal dendrites and depress in the proximal dendrites. G: current traces recorded at 5 min (black) and 13 min (red) after obtaining whole cell access. These were recorded simultaneously to the fluorescence transients shown in F with the same time base.
Fig. 6.
Fig. 6.
Ca2+ transients in control neurons do not show recording time-dependent enhancement. Neurons were held under whole cell voltage clamp with pipettes containing the Ca2+ sensitive dye, Oregon Green BAPTA 1. A: single optical section confocal image of this dye obtained 5 min after obtaining whole cell access. Left: image is at rest immediately prior to application of the stimulus. Right: image is from the last image frame obtained during application of a truncated LTD induction protocol in which synaptic stimulation (0.5 Hz) was applied during a voltage step protocol lasting for 20 s. B: images obtained as for A in the same neuron but after 13 min of whole cell access. C: peak amplitude of stimulus evoked fluorescence transients measured in the dendrites for time points from 5 to 13 min after obtaining whole cell access. Ca: measurements from the proximal and distal dendritic regions. Proximal dendrite was defined as the primary dendrite from the soma, distal dendrites as all others. Cb: normalized change in amplitude of evoked fluorescence transients over time after whole cell access in all control. D: traces showing fluorescence transients comparing responses from stimuli 5 min post whole cell access to 13 min after obtaining access. Da: from proximal dendrites. Db: all distal dendrites.
Fig. 7.
Fig. 7.
Inhibitor 2 did not cause a time-dependent modification of Ca2+ transients recorded following step protocols with either no synaptic or no NMDA component. Neurons were recorded as for Figs. 5 and 6 but no stimulation of synaptic inputs to the CA1 region was applied. A: peak amplitude of stimulus evoked fluorescence transients obtained during a 20 s voltage step to –40 mV, measured in the distal dendrites for time points from 5 to 21 min after obtaining whole cell access. B: normalized peak amplitude of evoked fluorescence transients over time after whole cell access in all controls for all neurons recorded. C: traces from cell in A showing fluorescence transients comparing responses from stimuli 5 min post whole cell access to 13 min after obtaining access from distal dendrites. D: current traces recorded at 5 and 13 min after obtaining whole cell access. These were recorded simultaneously to the fluorescence transients shown in C with the same time bases. Ea: peak amplitude of stimulus evoked fluorescence transients recorded in d-AP5 (50 μM) obtained during a 20 s voltage step to –40 mV while stimulating at 2 s intervals (as in Fig. 5) measured in the distal dendrites for time points from 5 to 13 min after obtaining whole cell access. (Inset: examples of Ca2+ transients at 5 and 13 min after obtaining whole cell access.) Eb: normalized peak amplitude of evoked fluorescence transients over time after whole cell access all neurons recorded under conditions in Ea.

Similar articles

Cited by

References

    1. Abraham WC, Bear MF. Metaplasticity: the plasticity of synaptic plasticity. Trends Neurosci 19: 126–130, 1996 - PubMed
    1. Alford S, Frenguelli BG, Schofield JG, Collingridge GL. Characterization of Ca2+ signals induced in hippocampal CA1 neurones by the synaptic activation of NMDA receptors. J Physiol 469: 693–716, 1993 - PMC - PubMed
    1. Bashir ZI, Alford S, Davies SN, Randall AD, Collingridge GL. Long-term potentiation of NMDA receptor-mediated synaptic transmission in the hippocampus. Nature 349: 156–158, 1991 - PubMed
    1. Bear MF. Mechanism for a sliding synaptic modification threshold. Neuron 15: 1–4, 1995 - PubMed
    1. Bortolotto ZA, Collett VJ, Conquet F, Jia Z, van der Putten H, Collingridge GL. The regulation of hippocampal LTP by the molecular switch, a form of metaplasticity, requires mGlu5 receptors. Neuropharmacology 49, Suppl 1: 13–25, 2005 - PubMed

Publication types

MeSH terms

Substances

LinkOut - more resources