. 2010 Nov;104(5):2462-73.
doi: 10.1152/jn.00312.2010. Epub 2010 Aug 18.

Molecular layer inhibitory interneurons provide feedforward and lateral inhibition in the dorsal cochlear nucleus

Affiliations

Molecular layer inhibitory interneurons provide feedforward and lateral inhibition in the dorsal cochlear nucleus

Michael T Roberts et al. J Neurophysiol. 2010 Nov.

Abstract

In the outer layers of the dorsal cochlear nucleus, a cerebellum-like structure in the auditory brain stem, multimodal sensory inputs drive parallel fibers to excite both principal (fusiform) cells and inhibitory cartwheel cells. Cartwheel cells, in turn, inhibit fusiform cells and other cartwheel cells. At the microcircuit level, it is unknown how these circuit components interact to modulate the activity of fusiform cells and thereby shape the processing of auditory information. Using a variety of approaches in mouse brain stem slices, we investigated the synaptic connectivity and synaptic strength among parallel fibers, cartwheel cells, and fusiform cells. In paired recordings of spontaneous and evoked activity, we found little overlap in parallel fiber input to neighboring neurons, and activation of multiple parallel fibers was required to evoke or alter action potential firing in cartwheel and fusiform cells. Thus neighboring neurons likely respond best to distinct subsets of sensory inputs. In contrast, there was significant overlap in inhibitory input to neighboring neurons. In recordings from synaptically coupled pairs, cartwheel cells had a high probability of synapsing onto nearby fusiform cells or other nearby cartwheel cells. Moreover, single cartwheel cells strongly inhibited spontaneous firing in single fusiform cells. These synaptic relationships suggest that the set of parallel fibers activated by a particular sensory stimulus determines whether cartwheel cells provide feedforward or lateral inhibition to their postsynaptic targets.


Figures

Fig. 1.
Fig. 1.
Individual parallel fibers activated by minimal stimulation synapse onto only 1 cell of a pair. A: in a recording from a pair of cartwheel cells that was not synaptically coupled, the minimal stimulus amplitude to reliably evoke excitatory postsynaptic currents (EPSCs) was 14 V. Stimuli at this amplitude evoked EPSCs in cartwheel cell 1 but not cartwheel cell 2, indicating that the activated parallel fiber only synapsed onto cartwheel cell 1. Larger stimuli activated additional parallel fibers and evoked EPSCs in both cells of the pair. B: similar to A but showing data from a synaptically coupled cartwheel-fusiform cell pair. The minimal stimulus (50 V) evoked EPSCs in the fusiform cell but not the cartwheel cell. C and D: as stimulus amplitudes were increased across trials, EPSCs were reliably detected in one cell of each pair (black data) before they were detected in the other (gray data). For each cell, EPSC amplitudes tended to cluster at certain levels consistent with stimuli of a given voltage range activating a constant number of parallel fibers. E and F: cumulative plots tracking when stimuli succeeded in evoking EPSCs. Data in C and E are from the pair shown in A; D and F from the pair in B. G: across the pairs tested, minimal stimuli reliably evoked EPSCs in 1 cell of each pair (lower threshold cell) while rarely evoking EPSCs in the other cell (higher threshold cell). The ratio of the number of EPSCs detected in the higher threshold cell versus the lower threshold cell prior to the reliable detection of EPSCs in the higher threshold cell quantifies this difference (see text for details). Five types of pairs were examined: pairs of cartwheel cells that were (CwC→CwC, n = 6 pairs, 10 stimulus sites) or were not (CwC-CwC, n = 6 pairs, 8 stimulus sites) synaptically coupled, cartwheel-fusiform cell pairs that were (CwC→FC, n = 6 pairs, 10 stimulus sites) or were not (CwC-FC, n = 6 pairs, 10 stimulus sites) synaptically coupled, and pairs of fusiform cells (FC-FC, n = 2 pairs, 4 stimulus sites). No group of pairs was significantly different from another (P > 0.05, 1-way ANOVA). Error bars show SE.
Fig. 2.
Fig. 2.
Comparison of miniature and spontaneous EPSC (mEPSC and sEPSC) properties. Synchronous EPSCs were occasionally detected in the pair of reciprocally connected cartwheel cells in A (*) but not the pair of reciprocally connected cartwheel cells in B. In cartwheel cells, C, and fusiform cells, D, distributions of sEPSC amplitudes (formula image
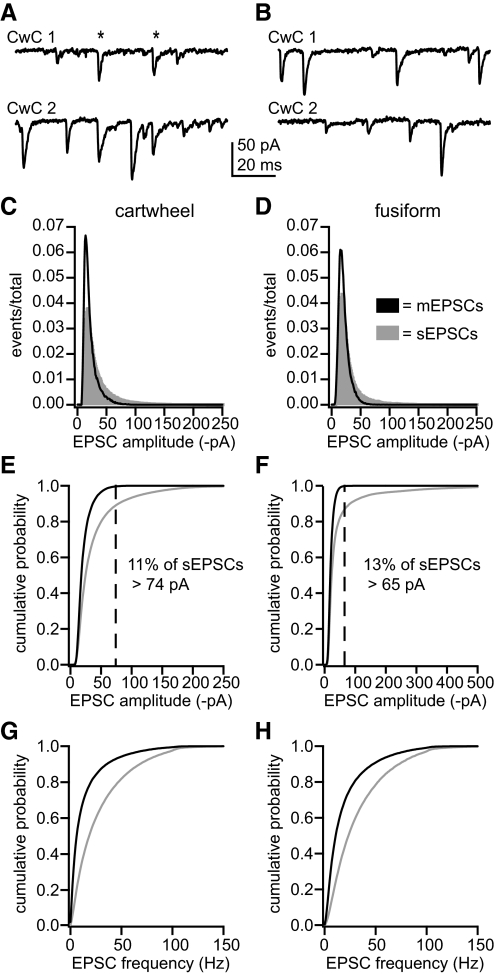
) were skewed toward larger events than distributions of mEPSC amplitudes (■). In cartwheel cells, mean EPSC amplitudes were 22.4 ± 2.8, mEPSCs, and 39.5 ± 21.0, sEPSCs. In fusiform cells, mean EPSC amplitudes were 21.6 ± 4.0, mEPSCs, and 46.3 ± 51.0, sEPSCs. E and F: cumulative distributions of the amplitude data shown in C and D, respectively. More than 99% of mEPSCs were smaller than the amplitude cutoffs (dashed lines), which were established to distinguish between sEPSCs that might have resulted from miniature release events and those that were probably the product of action potential-evoked release. In cartwheel cells, 11% of sEPSCs were larger than the 74 pA cutoff, and, in fusiform cells, 13% were larger than the 65 pA cutoff. G and H: cumulative distributions of instantaneous EPSC frequencies. Mean sEPSC frequencies were significantly higher than mean mEPSC frequencies in cartwheel cells, G, and fusiform cells, H, (t-test, P < 0.05). Cartwheel cells: sEPSC frequency = 29 ± 9 Hz, mEPSC frequency = 14 ± 5 Hz. Fusiform cells: sEPSC frequency = 33 ± 9 Hz, mEPSC frequency = 20 ± 3 Hz. All distributions represent averages of distributions across multiple cells for each group. Cartwheel cells: n = 8, mEPSC group; 52, sEPSC group. Fusiform cells: n = 6, mEPSC group; 22, sEPSC group.
Fig. 3.
Fig. 3.
sEPSCs were rarely correlated in paired recordings. A and B: cross-interval histograms analyzing the relative timing of sEPSCs from the same pairs shown in Fig. 2, A and B, respectively. The peak near 0 lag in A indicates that a portion of sEPSCs detected in that pair occurred simultaneously. Dashed lines, bin heights expected from randomly coincident events. C: the percentage of sEPSCs that occurred synchronously in pairs of various compositions and synaptic connectivities averaged <6% for each group. Analyses only compared events that were unlikely to be mEPSCs (see text). No group of pairs was significantly different from another (P > 0.05, 1-way ANOVA) or from 0 (P > 0.05, t-test). Error bars show SE.
Fig. 4.
Fig. 4.
Parallel fiber-evoked excitatory postsynaptic potentials (EPSPs) elicit action potentials in a cartwheel cell (left) and a fusiform cell (right) at rest. A and B: stimuli over a range of amplitudes delivered to the molecular layer elicited no response, EPSPs of various amplitudes, or action potentials in whole cell current-clamp recordings of a cartwheel cell and a fusiform cell. C and D: voltage-clamp recordings from the same cells demonstrate the currents elicited by stimuli over the tested range of amplitudes. E: summary data for the cartwheel cell in A and C. F: summary data for the fusiform cell in B and D. As stimulus amplitudes increased, the probability of evoking ≥1 action potentials (black data) in current-clamp recordings grew sigmoidally (E, cartwheel cell, x-half = 22.4 ± 0.4 V, r2 = 0.984; F, fusiform cell, × x-half = 26.7 ± 0.1 V, r2 = 0.998). Amplitudes of the underlying EPSCs exhibited corresponding increases (gray data). Error bars show SD.
Fig. 5.
Fig. 5.
Parallel fiber-evoked EPSPs elicit extra action potentials in a spontaneously firing cartwheel cell (left) and a spontaneously firing fusiform cell (right). A and B: in cell-attached recordings, stimuli ranging from 0 to 75 V were delivered to the molecular layer. Larger stimuli evoked the firing of additional action potentials, occasionally eliciting complex spikes in cartwheel cells, as in A, and bursts of ≥2 spikes in fusiform cells as in B. Arrows indicate when stimuli occurred. C and D: summary analyses showing changes in action potential firing rates elicited by stimuli from the tested range of amplitudes for the same cells as in A and B. Data represent the mean changes across 10 trials (cartwheel cell) and 15 trials (fusiform cell). Time axes in C and D also apply to A and B. E and F: after break-in to whole cell mode, the EPSCs evoked by the tested range of stimulus amplitudes were measured. G: summary data for the cartwheel cell in A, C, and E. H: summary data for the fusiform cell in B, D, and F. There was a sigmoidal relationship between the average, peak change in firing rate evoked by each stimulus amplitude and the corresponding mean amplitude of the EPSCs evoked by these stimuli (G, cartwheel cell, x-half = 248 ± 11 pA, r2 = 0.950; H, fusiform cell, x-half = 219 ± 5 pA, r2 = 0.984). A, B, E, and F are overlays of 15 sweeps.
Fig. 6.
Fig. 6.
Cartwheel cells are likely to synapse onto neighboring cartwheel and fusiform cells. In recordings from pairs of cartwheel cells, 1 cartwheel cell made a functional synapse onto the other in 39.8% of pairs (CwC→CwC). Another 8.5% of pairs were reciprocally coupled, meaning that each cartwheel cell in the pair synapsed onto the other (CwC↔CwC); 34.6% of cartwheel cells synapsed onto fusiform cells in cartwheel-fusiform cell pairs (CwC→FC). Numbers to right of bars indicate incidence of coupled pairs among the number of pairs tested.
Fig. 7.
Fig. 7.
Spontaneous IPSCs were frequently correlated in paired recordings. In a pair of synaptically coupled cartwheel cells, A, and a synaptically coupled cartwheel-fusiform cell pair, B, spontaneous inhibitory PSCs (sIPSCs) often occurred at the same time in both cells of each pair (asterisks). Many of these synchronous sIPSCs occurred in bursts, presumably due to the firing of complex spikes in a common presynaptic cartwheel cell. C and D: cross-interval histograms with large peaks near 0 lag indicate that a large portion of the sIPSCs detected in 1 cell of the pairs from A and B were correlated in time with sIPSCs detected in the other cell of each pair. Dashed lines indicate the bin counts expected from randomly coincident events. E: synchronous sIPSCs were commonly detected in recordings from pairs of cartwheel cells and cartwheel-fusiform cell pairs, whether or not they were synaptically coupled. The mean for each pair group was significantly greater than 0 (t-test, P < 0.05). N, number of pairs in each group.
Fig. 8.
Fig. 8.
Cartwheel cell-evoked inhibitory PSPs (IPSPs) inhibit fusiform cell spontaneous firing. In a recording from a synaptically coupled cartwheel-fusiform cell pair, whole cell current injection was used to alternately elicit simple (A, top) and complex spikes (B, top) in a current-clamped cartwheel cell. Simultaneously, the firing rate of a postsynaptic, spontaneously active fusiform cell was monitored through cell-attached recording (A and B, bottom). A and B, top traces show typical, single trials; bottom traces: overlaid results from 50 trials. Simple spikes were elicited by brief, depolarizing current injections followed immediately by hyperpolarizing current injections. C and D: raster plots show pauses in fusiform cell firing subsequent to the onset (gray vertical lines) of presynaptic simple, C, or complex spikes, D. The cumulative effect of these pauses is apparent in histograms (E and F) measuring the number of fusiform action potentials per 20 ms bin from 50 trials. Note in F the tendency of the fusiform cell to fire 140–160 ms following the presynaptic complex spike. Time scale in E applies to A and C; scale in F to B and D. Data were aligned such that 0 ms indicates the peak of the presynaptic simple spike or peak of the first spike of the complex spike. G and H: rupturing the cell-attached patch permitted whole cell recordings of the IPSCs evoked in the fusiform cell (bottom) by simple and complex spikes (top). Fusiform cell was voltage-clamped at −73 mV. I and J: mean changes in fusiform cell spontaneous firing rate induced by simple, I, and complex spikes, J (n = 5; presynaptic spikes occurred at time = 0 ms; 20 ms bins). Asterisks denote significant changes from baseline firing rate (P < 0.05, t-test). Significant changes were also observed at approximately the same time ranges when bin size was decreased to 10 ms or increased to 25 ms (data not shown).

Similar articles

Cited by

References

    1. Aizenman CD, Linden DJ. Regulation of the rebound depolarization and spontaneous firing patterns of deep nuclear neurons in slices of rat cerebellum. J Neurophysiol 82: 1697–1709, 1999 - PubMed
    1. Arevian AC, Kapoor V, Urban NN. Activity-dependent gating of lateral inhibition in the mouse olfactory bulb. Nat Neurosci 11: 80–87, 2008 - PMC - PubMed
    1. Balakrishnan V, Trussell LO. Synaptic inputs to granule cells of the dorsal cochlear nucleus. J Neurophysiol 99: 208–219, 2008 - PubMed
    1. Barbour B. Synaptic currents evoked in Purkinje cells by stimulating individual granule cells. Neuron 11: 759–769, 1993 - PubMed
    1. Berrebi AS, Mugnaini E. Distribution and targets of the cartwheel cell axon in the dorsal cochlear nucleus of the guinea pig. Anat Embryol 183: 427–454, 1991 - PubMed

Publication types

LinkOut - more resources