. 2010 Nov;84(22):11994-2001.
doi: 10.1128/JVI.00653-10. Epub 2010 Aug 18.

Apoptosis of hepatitis B virus-infected hepatocytes prevents release of infectious virus

Affiliations

Apoptosis of hepatitis B virus-infected hepatocytes prevents release of infectious virus

Silke Arzberger et al. J Virol. 2010 Nov.

Abstract

Apoptosis of infected cells is critically involved in antiviral defense. Apoptosis, however, may also support the release and spread of viruses. Although the elimination of infected hepatocytes is required to combat hepatitis B virus (HBV) infection, it is still unknown which consequences hepatocyte apoptosis has for the virus and whether or not it is advantageous to the virus. To study this, we designed a cell culture model consisting of both HBV-producing cell lines and primary human hepatocytes serving as an infection model. We showed that the release of mature, enveloped virions was 80% to 90% reduced 24 h after the induction of apoptosis in HBV-replicating hepatoma cells or HBV-infected hepatocytes. Importantly, HBV particles released from apoptotic hepatocytes were immature and nonenveloped and proved not to be infectious. We found an inverse correlation between the strength of an apoptotic stimulus and the infectivity of the virus particles released: the more potent the apoptotic stimulus, the higher the ratio of nonenveloped capsids to virions and the lower their infectivity. Furthermore, we demonstrated that HBV replication and, particularly, the expression of the HBx protein transcribed from the viral genome during replication do not sensitize cells to apoptosis. Our data clearly reject the hypothesis that the apoptosis of infected hepatocytes facilitates the propagation of HBV. Rather, these data indicate that HBV needs to prevent the apoptosis of its host hepatocyte to ensure the release of infectious progeny and, thus, virus spread in the liver.


Figures

FIG. 1.
FIG. 1.
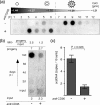
Sensitivity of HBV-producing HepG2 cells to apoptosis. HepG2, HepG2-H1.3, HepG2-H1.3x−, and HepAD38 cells were treated with UV-C light (UV) or anti-CD95 monoclonal Ab (MAb). (a and b) Phase-contrast microscopy (top) showed morphological changes of HepAD38 cells without (+Tet) (a) and with (−Tet) (b) HBV replication 24 h after UV-C irradiation (20 mJ/cm2). Dead cells were visualized by ethidium homodimer (EthD-1) staining (bottom). (c) Cell viabilities of the indicated cell lines after UV-C irradiation were determined by an XTT assay. Data are expressed as percentages of untreated cells (means ± standard deviations [SD]; n = 3). (d) Detection of caspase-3/7 activity by cleavage of Ac-DEVD-AFC fluorogenic substrates. Cell lysates of HepG2.2.15 cells were prepared 4 h after treatment with anti-CD95 Ab (1 μg/ml), UV-C irradiation, or a combination of both. Unexposed cells cultured in parallel served as a control. Data show the relative light units (RLU) per μg of protein (mean ± SD; n = 3). (e) Analysis of DNA fragmentation of HepG2.2.15 cells 30 h after treatment. Low-molecular-weight DNA was separated on a 1.4% agarose gel and visualized by ethidium bromide staining.
FIG. 2.
FIG. 2.
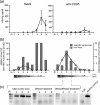
Physical properties of HBV particles released from HepG2.2.15 cells after apoptosis induction. (a and b) Characterization of HBV particles released due to their density profiles. (a) Twenty-four hours after UV-C irradiation (20 mJ/cm2), anti-CD95 MAb treatment (1 μg/ml), or a combination of both, cell culture media were subjected to CsCl gradient centrifugation, and collected fractions (F) were analyzed by dot blotting using a 32P-labeled HBV DNA probe. The pictogram illustrates CsCl densities and expected distributions of naked HBV DNA, naked capsids, and virions. (b) Density profile of concentrated culture medium 24 h after UV-C irradiation. (c) Immunoprecipitation by HBc (IPc) or HBs (IPs) antigen of the indicated density fractions followed by absolute quantification of the isolated nucleic acid contents using HBV DNA-specific primers. (d) HBV DNA Southern blot analysis of the indicated density fractions. To differentiate between circular and linear HBV DNA genomes, XhoI digestion was performed. The obtained fragments are marked by arrows: the 3.2-kb fragment was derived from circular DNA, and the 1.8- and 1.4-kb fragments were derived from linear DNA. M, molecular weight marker.
FIG. 3.
FIG. 3.
Analysis of the infectivity of HBV released from HepG2.2.15 cells. (a) PHH cultures were infected with HBV particles (left) or particles preincubated with neutralizing anti-HBs antibodies (right). Productive infection was monitored by progeny HBV DNA dot blot analysis (filled area) and HBeAg secretion (continuous line) up to 10 days p.i. HBV DNA-containing particles (viral particles [vp]) per cell were quantified by using a PhosphorImager apparatus (mean ± SD; n = 3). (b) Quantification of HBV cccDNA at 10 days p.i. using qPCR relative to the mitochondrial DNA content. Data are expressed as the number of copies of cccDNA per 10 cells (mean ± SD; n = 3). (c) Culture media of HepG2.2.15 cells collected 24 h after apoptosis induction with anti-CD95 MAb (1 μg/ml), UV-C irradiation (20 mJ/cm2), or combined treatments were transferred onto PHH. At the indicated time points, the establishment of infection was monitored by HBV progeny release using HBV DNA dot blot analysis of PHH culture media. The input was calculated from the amount of HBV DNA-containing particles per cell used for infection. In addition, the number of HBV progeny was calculated from the amount of HBV DNA-containing particles per cell released at day 10 p.i. (d) At day 10 p.i., with media from apoptosis-treated or mock-treated cells, PHH were lysed, and HBV cccDNA was quantified by qPCR. The values obtained were normalized to mitochondrial DNA content. Numbers of HBV cccDNA copies per cell are given (mean ± SD; n = 3). P values were analyzed by a Student's t test.
FIG. 4.
FIG. 4.
Structural characterization and infectivity of HBV particles released from apoptotic PHH. Thirty hours after anti-CD95 MAb (130 ng/ml) treatment and mock treatment of HBV-infected PHH, cell culture media were collected. (a) HBV particles contained were sedimented into a CsCl gradient. Shown are data from analyses of fractions (F) collected by dot blotting using a 32P-labeled HBV DNA probe. (b) Culture media of HBV-infected PHH undergoing anti-CD95 or mock treatment were transferred to PHH of a different donor. At the indicated time points, the establishment of a productive HBV infection was analyzed by progeny HBV DNA dot blot analysis. From the signal detected, the input MOI (HBV DNA-containing particles per cell used for infection) was calculated relative to an external standard. In addition, the number of progeny HBV was calculated from the amount of HBV DNA-containing particles released per cell at day 10 p.i. (c) Quantification of HBV cccDNA in PHH at day 10 p.i. using a specific qPCR. Results were normalized to mitochondrial DNA content. HBV cccDNA copies per cell are given (mean ± SD; n = 3). P values were determined by a Student's t test.
FIG. 5.
FIG. 5.
Characterization of HBV particles released from apoptotic PHH. Supernatants of HBV-infected PHH cultures were collected 24 h after anti-CD95 MAb (130 ng/ml) or mock treatment and subjected to CsCl gradient centrifugation. Twelve fractions (F) with decreasing densities (F1 to F12) were collected; F3 to F10 were used for further characterization. (a) HBsAg ELISA indicating enveloped HBV particles. Average values from three experiments ± standard errors of the means are given. (b) Qualitative and quantitative analysis of encapsidated viral nucleic acids using one-step RT-PCR. To discriminate between DNA and RNA, DNase digestion was performed. (Left) Mock treatment. (Right) Anti-CD95 treatment. The total amount of HBV nucleic acids (DNA plus RNA) (gray bars) detected in F8 of mock-treated cells was set to 100%. HBV RNA levels (continued line) of all samples are reported as parts per thousand. (c) Amplification products of qPCR runs of F4 to F6 with the indicated treatments were separated on a 2% agarose gel and visualized by ethidium bromide staining.

References

    1. Acs, G., M. A. Sells, R. H. Purcell, P. Price, R. Engle, M. Shapiro, and H. Popper. 1987. Hepatitis B virus produced by transfected Hep G2 cells causes hepatitis in chimpanzees. Proc. Natl. Acad. Sci. U. S. A. 84:4641-4644. - PMC - PubMed
    1. Cao, T., U. Lazdina, I. Desombere, P. Vanlandschoot, D. R. Milich, M. Sallberg, and G. Leroux-Roels. 2001. Hepatitis B virus core antigen binds and activates naive human B cells in vivo: studies with a human PBL-NOD/SCID mouse model. J. Virol. 75:6359-6366. - PMC - PubMed
    1. Chirillo, P., S. Pagano, G. Natoli, P. L. Puri, V. L. Burgio, C. Balsano, and M. Levrero. 1997. The hepatitis B virus X gene induces p53-mediated programmed cell death. Proc. Natl. Acad. Sci. U. S. A. 94:8162-8167. - PMC - PubMed
    1. Dandri, M., J. Petersen, R. J. Stockert, T. M. Harris, and C. E. Rogler. 1998. Metabolic labeling of woodchuck hepatitis B virus X protein in naturally infected hepatocytes reveals a bimodal half-life and association with the nuclear framework. J. Virol. 72:9359-9364. - PMC - PubMed
    1. Desaintes, C., C. Demeret, S. Goyat, M. Yaniv, and F. Thierry. 1997. Expression of the papillomavirus E2 protein in HeLa cells leads to apoptosis. EMBO J. 16:504-514. - PMC - PubMed

Publication types