. 2010 Oct 1;21(19):3317-29.
doi: 10.1091/mbc.E10-03-0245. Epub 2010 Aug 18.

Integrin-mediated cell attachment induces a PAK4-dependent feedback loop regulating cell adhesion through modified integrin alpha v beta 5 clustering and turnover

Affiliations

Integrin-mediated cell attachment induces a PAK4-dependent feedback loop regulating cell adhesion through modified integrin alpha v beta 5 clustering and turnover

Zhilun Li et al. Mol Biol Cell. .

Abstract

Cell-to-extracellular matrix adhesion is regulated by a multitude of pathways initiated distally to the core cell-matrix adhesion machinery, such as via growth factor signaling. In contrast to these extrinsically sourced pathways, we now identify a regulatory pathway that is intrinsic to the core adhesion machinery, providing an internal regulatory feedback loop to fine tune adhesion levels. This autoinhibitory negative feedback loop is initiated by cell adhesion to vitronectin, leading to PAK4 activation, which in turn limits total cell-vitronectin adhesion strength. Specifically, we show that PAK4 is activated by cell attachment to vitronectin as mediated by PAK4 binding partner integrin αvβ5, and that active PAK4 induces accelerated integrin αvβ5 turnover within adhesion complexes. Accelerated integrin turnover is associated with additional PAK4-mediated effects, including inhibited integrin αvβ5 clustering, reduced integrin to F-actin connectivity and perturbed adhesion complex maturation. These specific outcomes are ultimately associated with reduced cell adhesion strength and increased cell motility. We thus demonstrate a novel mechanism deployed by cells to tune cell adhesion levels through the autoinhibitory regulation of integrin adhesion.


Figures

Figure 1.
Figure 1.
PAK4 activation by cell attachment onto vitronectin (VN). (A) Activation of transiently expressed HA-tagged PAK4 in COS-7 cells. COS-7 cells with transiently transfected HA-PAK4 were plated onto VN-coated dishes for the indicated times. PAK4 was immunoprecipitated (IP) from cell lysates, and kinase activity was determined by an in vitro kinase assay using myelin basic protein (MBP) as substrate (top). Quantified PAK4 kinase activities relative to the zero time point of PAK4 activity are indicated below. Bottom panel, lysate content of HA-PAK4 by immunoblotting (IB). (B) Activation of transiently expressed Flag-PAK4 in MCF-7 cells. Mixed MCF-7 cell clones stably expressing Flag-PAK4 were plated onto VN and analyzed for PAK4 kinase activity as described above (top). Middle, lysate content of proteins detected by anti-FLAG; bottom, Coomassie blue gel staining of MBP loading. (C) Autophosphorylation of stable expressed Flag-PAK4 in MCF-7 cells. Mixed MCF-7 cell clones stably expressing Flag-PAK4 were plated onto VN and analyzed for PAK4 autophosphorylation as described above (top). Bottom, quantified PAK4 autophosphorylation relative to the zero time point of PAK4 autophosphorylation are indicated below. Bottom panel, lysate content of proteins detected by anti-FLAG. (D) Activation of endogenous PAK4 in MCF-7 cells. MCF-7 cells were plated onto VN, and after anti-PAK4 IP, endogenous PAK4 activity was analyzed (top). Bottom, lysate contents of PAK4 protein. The displayed results in Figure 1 are representative among at least three experiments. Note that Figure 1D, top panel, stems from the same gel and was rearranged for display purpose.
Figure 2.
Figure 2.
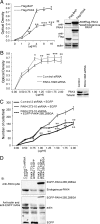
Role of PAK4 in MCF-7 cell adhesion on VN. (A) Left, cell attachment of MCF-7 cells stably expressing Flag-PAK4 or Flag-BAP at different coating concentrations of VN was determined. Graph shows means of optical density ± 95% confidence intervals; n = 3 from one representative experiment. Right, the protein levels of endogenous PAK4 and stably expressed Flag-PAK4-WT or Flag-BAP (as a control) in MCF-7 cells were detected by IB using anti-PAK4 pAb (top panel), anti-Flag (M2) mAb (middle panel) with anti-actin mAb as loading control (bottom panel). (B) Left, cell attachment of MCF-7 cells transiently expressing PAK4-siRNA or control siRNA at different coating concentrations of VN was determined. Graph shows means of optical density ± 95% confidence intervals; n = 3 from one experiment. Right, PAK4 siRNA-mediated knockdown was determined by IB using tubulin as loading control. (C) Cell attachment was determined of MCF-7 stably expressing control shRNA and stable PAK4 shRNA expressing MCF-7 cells transiently transfected with EGFP (as a control) or EGFP-PAK4-AC285, 288GA (RNAi-resistant PAK4) at different coating concentrations of VN. Graph shows means of number of cells per field ± 95% confidence intervals; n = 3 from one experiment. (D) PAK4 shRNA-mediated knockdown and expression levels of EGFP and EGFP-PAK4 for cells used in C were determined by IB using actin as loading control. All experiments in Figure 2 were repeated at least three times with similar results. p values are indicated for statistically discernable differences compared with control (A and B) or to PAK4-shRNA cells (C) according to unpaired two-tailed t test (*p ≤ 0.05; **p ≤ 0.01; ***p ≤ 0.001).
Figure 3.
Figure 3.
Influence of PAK4 transient or stable overexpression on CMAC size and number. (A) Images from control MCF-7 cells or MCF-7 cells transiently expressing HA-PAK4-WT 3 h after replating onto VN, stained for integrin αvβ5 and HA-tag as indicated. Bar, 20 μm. (B) Quantification of CMAC numbers at the cellular periphery. The results are displayed as means ± SEM of the number of peripheral CMACs within 5 μm of the cell border per cell; between three independent experiments. (C and D) Quantification of CMAC sizes at the cellular periphery. The sizes of the CMACs are categorized into small (≤1 μm2), medium (from >1 to ≤2 μm2), and large (>2 μm2) adhesions. Values represent the percentage distribution (C) or number per cell (D) for each group expressed as mean ± SEM between three independent experiments. (E and G) MCF-7 cells stably expressing Flag-BAP or Flag-PAK4-WT were plated onto VN and fixed after 6 h. Cells were stained with anti-αvβ5 (E) or anti-vinculin (G) antibodies and costained with rhodamine-phalloidin. Bar, 25 μm. (F and H) Quantification of the number of CMACs at the cellular periphery as described in Materials and Methods. Graphs show means of CMACs per cell ± 95% confidence intervals; n = 48 (F) and n = 40 (H). In addition to effects by PAK4 on CMACs, we observed fewer actin stress fibers and also an induction of filopodia (arrows) in some WT PAK4-overexpressing cells compared with controls. p values indicated according to unpaired two-tailed t test.
Figure 4.
Figure 4.
Quantitative image analysis of CMAC component intensity and colocalization. Three-channel confocal images were acquired of a single MCF7 cell expressing either EGFP (A–F) or EGFP-PAK4 (J–O) and labeled for integrin αvβ5 (A, D, J, and M) and F-actin (B, E, K, and N). Cell boundaries were defined using F-actin labeling (green lines in images D, E, M, and N cropped from yellow regions of images A, B, J, and K). CMACs within these boundaries were then detected and defined using the integrin αvβ5 channel (red outlines in D, E, and M, N; blue lines within individual CMACs indicate CMAC major axes). CMAC center of mass coordinates (X and Y), CMAC area, mean CMAC intensity (αvβ5 and F-actin), and intra-CMAC colocalization (as defined by Pearson's r within each CMAC) of αvβ5 and F-actin were measured. Cropped, merged raw images of integrin αvβ5 (green) and F-actin (red) as well as either EGFP (blue, F) or EGFP-PAK4 (blue, O) show F-actin extending in protrusive structures beyond the existing CMACs, as well as strong colocalization (yellow) between integrin αvβ5 and F-actin in EGFP- but not EGFP-PAK4–expressing cells. Quantitative data (G–I and P–R) derived from cropped regions show each detected CMAC distributed according to its original X,Y coordinates, with dot size quantitatively reflecting original CMAC area. Dot color and associated number indicate mean integrin αvβ5 intensity (G, P), mean F-actin intensity (H and Q), or intra-CMAC colocalization of αvβ5 and F-actin (I and R), per CMAC. Color scales for αvβ5 intensity, F-actin intensity, and αvβ5/F-actin colocalization are shown to the right of P, Q, and R, respectively. These data demonstrate the method of quantitative data extraction and show directly the visual and quantitative evidence for reduced colocalization between F-actin and integrin αvβ5 within CMACs in cells overexpressing EGFP-PAK4 (see Figure 5 where equivalent data for 100s of cells and 1000s of CMACs are summarized). (S) The outcomes of Pearson's r analyses of two-channel colocalization. The distributions of red and green intensity information within Adhesion “X” reflect a strong spatial and intensity correlation between these two channels, resulting in a positive correlation score (a perfect positive correlation = 1; however, much lower values are typically detected in biological images due largely to poor signal to noise ratios). Red and green intensity distributions within Adhesion “Y” are inversed, resulting in a negative correlation (a perfect negative correlation = −1). Red and green intensity distributions appear unrelated in Adhesion “Z”, resulting in an r-value close to zero.
Figure 5.
Figure 5.
Influence of PAK4 overexpression on CMAC size, number, integrin clustering density, and integrin–actin connectivity. (A) Quantification of CMAC numbers at the cellular periphery from MCF-7 cells transiently expressing EGFP or EGFP-PAK4-WT. Graph shows means of the number of peripheral CMACs per cell ± 95% confidence intervals from 47 (EGFP control cells) and 48 (PAK4-overexpressing cells). (B) Quantification of integrin clustering density in CMACs at the cellular periphery. The mean intensity of endogenous αvβ5 labeling in CMACs <5 μm from the cell border. The results are displayed as means of all CMACs in the designated size classes (μm2) ± 95% confidence intervals. (C) Quantification of αvβ5 versus F-actin colocalization in CMACs <5 μm from the cell border. Calculated and displayed per CMAC using Pearson's r (r) ± 95% confidence intervals. (D) Quantification of F-actin mean intensity (labeled by phalloidin) in CMACs (the area overlaying αvβ5 labeling) <5 μm from the cell border as displayed in Figure 4G. Panels G, H, and I in Figure 4 are representative images showing the measurement of 4036 CMACs taken from 47 EGFP control cells and 2789 CMACs from 48 EGFP-PAK4-overexpressing cells. All data in Figure 5 are derived from at least three distinct experiments.
Figure 6.
Figure 6.
Influence of PAK4 knockdown on CMAC size, number, integrin-clustering density, and actin content. (A) MCF-7 cells stably expressing PAK4-shRNA or control shRNA were plated onto VN and fixed 3 h after replating. Cells were stained with an anti-integrin αvβ5 antibody and costained with rhodamine-phalloidin. Bar, 20 μm. (B) Quantification of the number of CMACs <5 μm from the cellular periphery. The results are presented as mean of number of CMACs per cell ± 95% confidence intervals; n = 36 (shRNA control cells) and 40 (PAK4-shRNA cells); p values according to unpaired two-tailed t test. (C) Distribution of CMAC sizes <5 μm from the cellular periphery; fold change in frequency of different CMAC size classes. (D) Quantification of integrin clustering density in CMACs at the cellular periphery. The mean intensity of endogenous αvβ5 labeling in CMACs <5 μm from the cell border was analyzed. The results are displayed as means of all CMACs in the designated size classes (μm2) ± 95% confidence intervals. (E) Quantification of F-actin mean pixel intensity (labeled by phalloidin) in CMACs (the area overlaying αvβ5 labeling) <5 μm from the cell border, displayed as in D. (F) Quantification of αvβ5 versus F-actin colocalization in CMACs <5 μm from the cell border. Calculated and displayed per CMAC using Pearson's r (r) ± 95% confidence intervals. Data for D–F are derived from three independent experiments measuring 4666 CMACs (36 shRNA control cells) and 9235 CMACs (40 PAK4 shRNA cells). All of the experiments in Figure 6 were repeated at least three times with similar results.
Figure 7.
Figure 7.
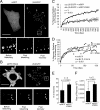
PAK4 promotes integrin αvβ5 turnover within CMACs. FRAP analysis of integrin β5-EGFP turnover in focal adhesions of (A) MCF-7 cells coexpressing mRFP and β5-EGFP or (B) mRFP-PAK4 and β5-EGFP. Enlarged images are shown (from boxes in A and B) containing individually bleached adhesions before bleaching, immediately after bleaching, and after 900-s recovery (arrowheads in bottom panels of A and B indicates bleached focal adhesions). Bar, 25 μm. (C) Quantified integrin β5-EGFP recovery in CMACs after bleaching of cells coexpressing mRFP-PAK4 or mRFP control. The mean fluorescence intensity in the bleached region was quantified and expressed as the percentage recovery relative to the mean of three prebleached values (for that region). Background diffuse integrin intensity within the plasma membrane was subtracted from all values and further corrections were applied for nonspecific bleaching. Values represent means ± SEM from three experiments, each with a minimum of five cells per condition, with a total of 100 adhesions analyzed after photobleaching. Statistically discernable difference between mRFP and mRFP-PAK4 recovery curves was assessed at each time point; with p = 0.018 at 30 s after bleaching, and p < 0.001 at all times after 30 s according to a two-tailed unpaired t test. (D) Equivalent analysis of β5-EGFP recovery after bleaching of plasma membrane regions devoid of CMACs in cells coexpressing mRFP-PAK4 or mRFP control. Values represent means from three distinct experiments including eight cells and 13 bleached regions per condition. A two-tailed unpaired t test of the means at all time points reveals a statistically discernable difference p = 0.011, and t test using all samples and all time points indicates p = 1.7 × 10⁻⁹. Fitted lines represent free diffusion recovery functions as previously described (Scott et al., 2006). (E and F) Analysis of the first order recovery (excluding the first 120 s after bleaching that include recovery from free diffusion within the plasma membrane) of β5-EGFP in CMACs reveals significantly enhanced percentage of recovery (E) and recovery rate (F) in the presence of mRFP-PAK4. p values were calculated using two-tailed unpaired t tests. Representative FRAP Movies for Figure 7 are presented in the supplementary information.

Similar articles

Cited by

References

    1. Abo A., Qu J., Cammarano M. S., Dan C., Fritsch A., Baud V., Belisle B., Minden A. PAK4, a novel effector for Cdc42Hs, is implicated in the reorganization of the actin cytoskeleton and in the formation of filopodia. EMBO J. 1998;17:6527–6540. - PMC - PubMed
    1. Ahmed T., Shea K., Masters J. R., Jones G. E., Wells C. M. A PAK4-LIMK1 pathway drives prostate cancer cell migration downstream of HGF. Cell. Signal. 2008;20:1320–1328. - PubMed
    1. Albiges-Rizo C., Destaing O., Fourcade B., Planus E., Block M. R. Actin machinery and mechanosensitivity in invadopodia, podosomes and focal adhesions. J. Cell Sci. 2009;122:3037–3049. - PMC - PubMed
    1. Anthis N. J., Haling J. R., Oxley C. L., Memo M., Wegener K. L., Lim C. J., Ginsberg M. H., Campbell I. D. Beta integrin tyrosine phosphorylation is a conserved mechanism for regulating talin-induced integrin activation. J. Biol. Chem. 2009;284:36700–36710. - PMC - PubMed
    1. Ballestrem C., Hinz B., Imhof B. A., Wehrle-Haller B. Marching at the front and dragging behind: differential alphaVbeta3-integrin turnover regulates focal adhesion behavior. J. Cell Biol. 2001;155:1319–1332. - PMC - PubMed

Publication types