. 2010 Nov;299(5):F1065-77.
doi: 10.1152/ajprenal.00277.2010. Epub 2010 Aug 18.

Role of the Rhesus glycoprotein, Rh B glycoprotein, in renal ammonia excretion

Affiliations

Role of the Rhesus glycoprotein, Rh B glycoprotein, in renal ammonia excretion

Jesse M Bishop et al. Am J Physiol Renal Physiol. 2010 Nov.

Abstract

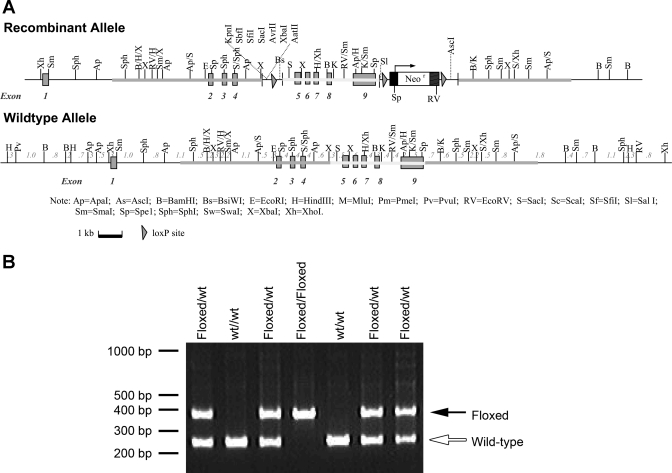
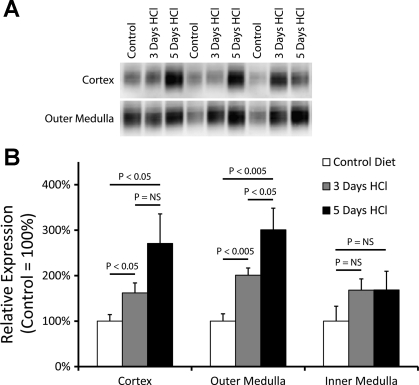
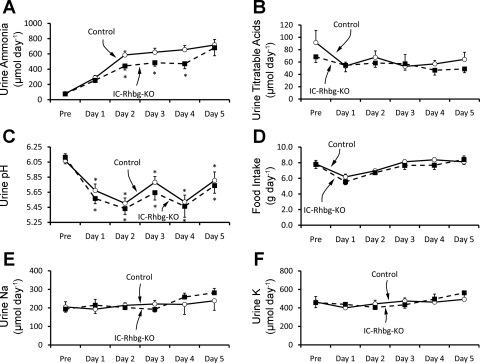
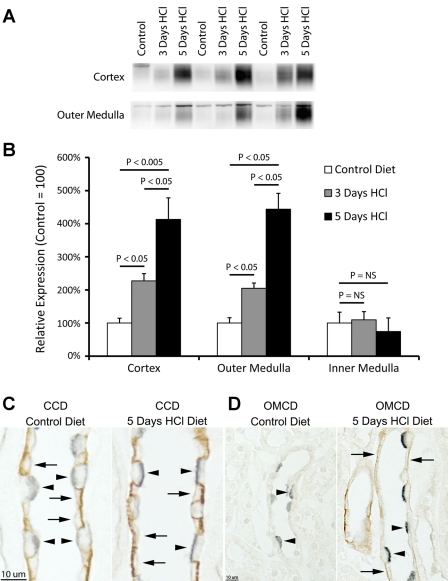
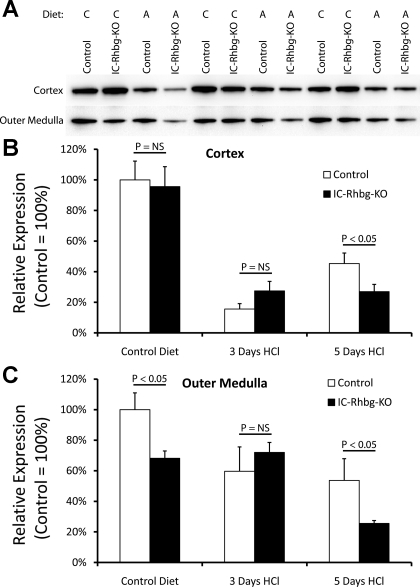
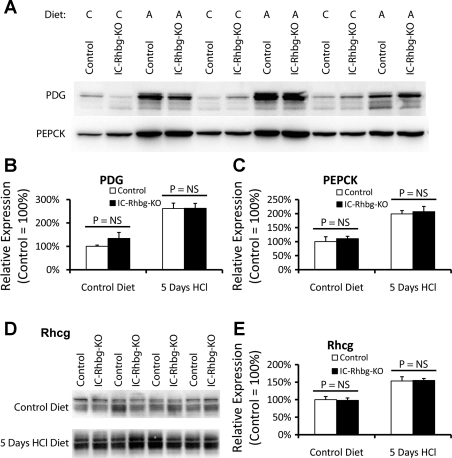
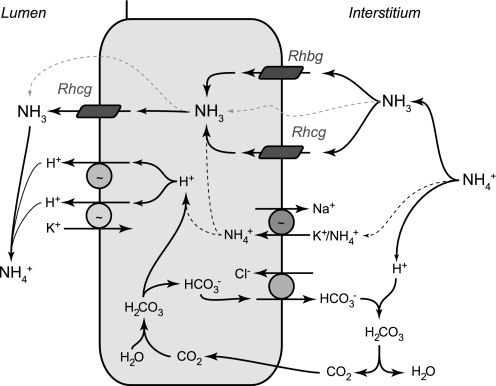
Rh B glycoprotein (Rhbg) is a member of the Rh glycoprotein family of ammonia transporters. In the current study, we examine Rhbg's role in basal and acidosis-stimulated acid-base homeostasis. Metabolic acidosis induced by HCl administration increased Rhbg expression in both the cortex and outer medulla. To test the functional significance of increased Rhbg expression, we used a Cre-loxP approach to generate mice with intercalated cell-specific Rhbg knockout (IC-Rhbg-KO). On normal diet, intercalated cell-specific Rhbg deletion did not alter urine ammonia excretion, pH, or titratable acid excretion significantly, but it did decrease glutamine synthetase expression in the outer medulla significantly. After metabolic acidosis was induced, urinary ammonia excretion was significantly less in IC-Rhbg-KO than in control (C) mice on days 2-4 of acid loading, but not on day 5. Urine pH and titratable acid excretion and dietary acid intake did not differ significantly between acid-loaded IC-Rhcg-KO and C mice. In IC-Rhbg-KO mice, acid loading increased connecting segment (CNT) cell and outer medullary collecting duct principal cell Rhbg expression. In both C and IC-Rhbg-KO mice, acid loading decreased glutamine synthetase in both the cortex and outer medulla; the decrease on day 3 was similar in IC-Rhbg-KO and C mice, but on day 5 it was significantly greater in IC-Rhbg-KO than in C mice. We conclude 1) intercalated cell Rhbg contributes to acidosis-stimulated renal ammonia excretion, 2) Rhbg in CNT and principal cells may contribute to renal ammonia excretion, and 3) decreased glutamine synthetase expression may enable normal rates of ammonia excretion under both basal conditions and on day 5 of acid loading in IC-Rhbg-KO mice.


Figures

Fig. 1.
Fig. 1.
Generation of floxed Rhbg mice. A: vector used to generate loxP-flanked (floxed) Rhbg gene. B: PCR amplification of tail clip DNA showing differentiation of wild-type (wt) and floxed Rhbg alleles.
Fig. 2.
Fig. 2.
Effect of metabolic acidosis on renal Rhbg expression. A: changes in Rhbg protein expression by immunoblot analysis. B: quantified data. HCl-induced metabolic acidosis results in time-dependent increases in Rhbg expression in the cortex and outer medulla. Rhbg expression in the inner medulla was not significantly increased. NS, not significant.
Fig. 3.
Fig. 3.
Effect of metabolic acidosis on renal Rhbg immunolabel. Immunolocalization of Rhbg confirmed increases in Rhbg expression after 5 days of HCl acid loading. In all panels, signal for Rhbg immunoreactivity is brown; H+-ATPase immunoreactivity is blue. A and B: 5 days HCl acid loading (B) increased Rhbg immunoreactivity in the connecting segment (CNT) and initial collecting tubule compared with control (A). C and D: no differences in cortical collecting duct (CCD) Rhbg immunoreactivity were apparent in control vs. 5-day HCl diet mice. Intercalated cells (arrows) are identified by intense basolateral Rhbg immunolabel and prominent apical H+-ATPase, and principal cells (arrowheads) by moderate basolateral Rhbg immunolabel and minimal or no apical H+-ATPase. E and F: in the outer medullary collecting duct in the outer stripe (OMCDo), Rhbg immunoreactivity in both intercalated cells (arrows) and principal cells (arrowheads) was increased by 5-day HCl loading. G and H: increased intercalated and principal cell Rhbg immunolabel and intercalated cell hypertrophy in the OMCD in the inner stripe (OMCDi) in response to HCl metabolic acidosis.
Fig. 4.
Fig. 4.
Rhbg expression in intercalated cell-specific Rhbg knockout (IC-Rhbg-KO) mouse kidney. A and B: low-magnification images showing reduced Rhbg immunoreactivity in kidneys of IC-Rhbg-KO mice compared with control (C). C and D: double-immunolabeling in the CCD with antibodies to Rhbg (brown) and H+-ATPase (blue) used to characterize cell-specific Rhbg expression in C and IC-Rhbg-KO mice. C: C mice exhibited intact Rhbg expression in both intercalated cells (arrows) and principal cells (arrowheads), with greater immunolabel in intercalated cells. D: IC-Rhbg-KO mice had normal principal cell Rhbg immunoreactivity (arrowheads), but intercalated cells lacked Rhbg immunolabel (arrows). E and F: Rhbg expression in the OMCD of C and IC-Rhbg-KO mice. Again, basolateral Rhbg immunolabel is absent in intercalated cells (arrows) and intact in principal cells (arrowheads) in IC-Rhbg-KO mice.
Fig. 5.
Fig. 5.
Effect of IC-Rhbg-KO on renal ammonia excretion in response to metabolic acidosis. A: urinary ammonia excretion in IC-Rhbg-KO and C mice. Mice were placed on control diet for 1 day and then changed to HCl diet. On days 2, 3, and 4 of acid loading, IC-Rhbg-KO mice excreted significantly less urinary ammonia than did C mice. B: urine titratable acid excretion in IC-Rhbg-KO and C mice. There was no significant difference in urine titratable acid excretion either before acid loading or at any time point during the HCl acid-loading protocol. C: urine pH during the same time period. Urine pH decreased significantly with induction of metabolic acidosis in both IC-Rhbg-KO and C mice, but it did not differ significantly between IC-Rhbg-KO and C mice either on control diet or any day after acid loading (*P < 0.05 vs. pH before acid loading). D: food intake in IC-Rhbg-KO and C mice. HCl acid loading was accomplished by adding 0.4 M HCl to powdered standard rodent chow. Food intake, and therefore the acid load, did not differ significantly between C and IC-Rhbg-KO mice either before or during acid loading. E: urinary Na+ excretion in C and IC-Rhbg-KO mice. There was no significant difference in urinary Na+ excretion between C and IC-Rhbg-KO mice either under basal conditions or in response to acid loading. F: urinary K+ excretion in C and IC-Rhbg-KO mice. There was no significant difference in urinary K+ excretion between C and IC-Rhbg-KO mice either under basal conditions or in response to acid loading. N = 18 for both C and IC-Rhbg-KO before acid loading and on days 1-3 of acid loading and N = 10 on days 4 and 5 of acid loading in all panels. *P < 0.05 vs. C mice.
Fig. 6.
Fig. 6.
Effect of acid loading on Rhbg expression in IC-Rhbg-KO mice. A: immunoblot analyses of Rhbg expression in IC-Rhbg-KO mice fed control diet (powdered rodent chow + H2O) or acid-loading diet (powdered rodent chow + HCl, 0.4 M). B: quantified Rhbg expression. IC-Rhbg-KO mice show a time-dependent, progressive increase in Rhbg expression in both the cortex and the outer medulla, while expression in the inner medulla does not change significantly. C: immunolocalization of Rhbg in the CCD of IC-Rhbg-KO mice on control diet and after 5-day HCl acid loading. Double immunolabel for H+-ATPase (blue) and Rhbg (brown) was used to differentiate intercalated and principal cells. Intercalated cells (arrowheads) lack Rhbg expression; acid loading increases Rhbg immunolabel in principal cells (arrows). D: same pattern of expression in the OMCD. Acid loading increases principal cell (arrows) Rhbg immunolabel.
Fig. 7.
Fig. 7.
Effect of IC-Rhbg-KO and acid loading on glutamine synthetase expression. A: glutamine synthetase expression by immunoblot analyses in the cortex and outer medulla of IC-Rhbg-KO and C mice. Diet is either control (C) or acid (A). B: quantified data. In the cortex, IC-Rhbg-KO did not alter glutamine synthetase expression on control diet. Metabolic acidosis decreased glutamine synthetase expression in the cortex in both C and IC-Rhbg-KO mice. After 3 days of acid loading, there was no difference in glutamine synthetase expression between C and IC-Rhbg-KO mice. However, after 5 days of acid loading, glutamine synthetase expression was decreased significantly more in IC-Rhbg-KO mice than in C mice. C: changes in glutamine synthetase expression in the outer medulla in response to IC-Rhbg-KO and to acid loading. Under basal conditions, glutamine synthetase expression was significantly less in IC-Rhbg-KO than in C mice. Acid loading decreased glutamine synthetase expression. After 3 days of acid loading, glutamine synthetase expression did not differ significantly in the outer medulla between C and IC-Rhbg-KO mice. However, after 5 days of acid loading, glutamine synthetase expression was decreased significantly more in IC-Rhbg-KO than in C mice.
Fig. 8.
Fig. 8.
Effect of IC-Rhbg-KO on phosphate-dependent glutaminase (PDG), phosphenolpyruvate carboxykinase (PEPCK), and Rhcg expression. A: immunoblot analysis of PDG and PEPCK expression in the cortex of C and IC-Rhbg-KO mice. Diet: C or A. B: quantification of PDG protein expression. Cortical PDG expression is not significantly different between IC-Rhbg-KO and C mice while on control diet. Acid loading increases PDG expression but PDG expression does not differ significantly between C and IC-Rhbg-KO mice. C: quantification of PEPCK expression. Cortical PEPCK expression is not significantly different between IC-Rhbg-KO and C mice fed control diet. Acid loading increases PEPCK expression, but PEPCK expression does not differ significantly between C and IC-Rhbg-KO acid-loaded mice. D: immunoblot analysis of Rhcg expression in control and IC-Rhbg-KO mice on control diet and after acid loading. E: quantification of Rhcg expression. Rhcg protein expression does not differ between C and IC-Rhbg-KO mice on control diet. Metabolic acidosis increases Rhcg expression, but there is no difference in Rhcg expression between acid-loaded C and IC-Rhbg-KO mice.
Fig. 9.
Fig. 9.
Model of collecting duct ammonia secretion. Interstitial NH4+ is in equilibrium with NH3 and H+. NH3 is transported across the basolateral membrane through both Rhbg and Rhcg. In the inner MCD (IMCD), basolateral Na+-K+-ATPase contributes to NH4+ transport; NH4+ then dissociates to NH3 and H+ (black dotted line). Intracellular NH3 is secreted across the apical membrane by apical Rhcg. H+-ATPase and H+-K+-ATPase secrete H+; H+ combines with luminal NH3 to form NH4+, which is “trapped” in the lumen. In addition, there are also components of diffusive NH3 movement across both the basolateral and apical plasma membranes (gray dotted lines). Intracellular H+ is generated by CA II-accelerated CO2 hydration that forms carbonic acid, which dissociates to H+ and HCO3. Basolateral Cl/HCO3 exchange transports HCO3 across the basolateral membrane; HCO3 combines with H+ released from NH4+ to form carbonic acid, which dissociates to CO2 and water. This CO2 can recycle into the cell, supplying the CO2 used for cytosolic H+ production. The net result is NH4+ transport from the peritubular space into the luminal fluid.

Similar articles

Cited by

References

    1. Biver S, Belge H, Bourgeois S, Van Vooren P, Nowik M, Scohy S, Houillier P, Szpirer J, Szpirer C, Wagner CA, Devuyst O, Marini AM. A role for Rhesus factor Rhcg in renal ammonium excretion and male fertility. Nature 456: 339–343, 2008 - PubMed
    1. Brown ACN, Hallouane D, Mawby WJ, Karet FE, Saleem MA, Howie AJ, Toye AM. RhCG is the major putative ammonia transporter expressed in human kidney and RhBG is not expressed at detectable levels. Am J Physiol Renal Physiol 296: F1279–F1290, 2009 - PMC - PubMed
    1. Chambrey R, Goossens D, Bourgeois S, Picard N, Bloch-Faure M, Leviel F, Geoffroy V, Cambillau M, Colin Y, Paillard M, Houillier P, Cartron JP, Eladari D. Genetic ablation of Rhbg in mouse does not impair renal ammonium excretion. Am J Physiol Renal Physiol 289: F1281–F1290, 2005 - PubMed
    1. Conjard A, Komaty O, Delage H, Boghossian M, Martin M, Ferrier B, Baverel G. Inhibition of glutamine synthetase in the mouse kidney: a novel mechanism of adaptation to metabolic acidosis. J Biol Chem 278: 38159–38166, 2003 - PubMed
    1. Damian AC, Pitts RF. Rates of glutaminase I and glutamine synthetase reactions in rat kidney in vivo. Am J Physiol 218: 1249–1255, 1970 - PubMed

Publication types

MeSH terms

LinkOut - more resources