. 2010 Nov 5;285(45):35039-46.
doi: 10.1074/jbc.M110.156927. Epub 2010 Aug 18.

TPC2 is a novel NAADP-sensitive Ca2+ release channel, operating as a dual sensor of luminal pH and Ca2+

Affiliations

TPC2 is a novel NAADP-sensitive Ca2+ release channel, operating as a dual sensor of luminal pH and Ca2+

Samantha J Pitt et al. J Biol Chem. .

Abstract

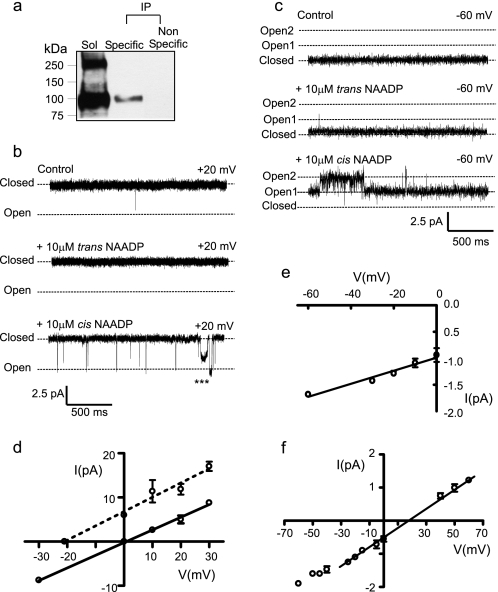
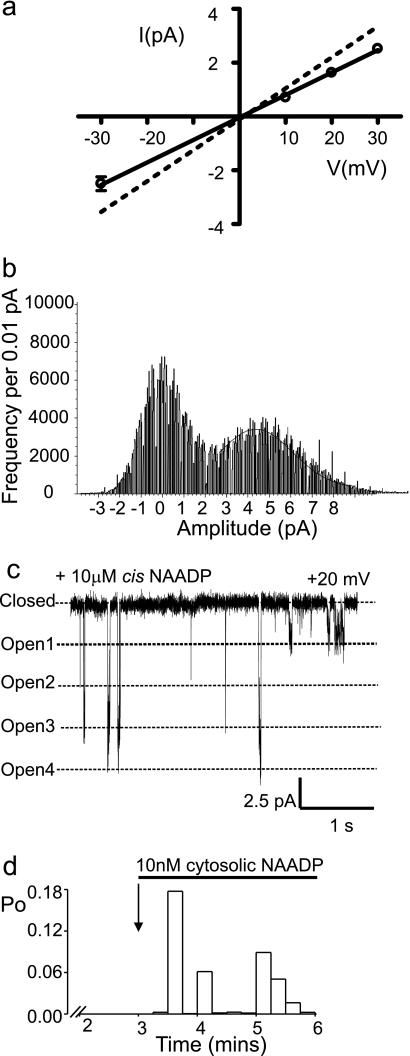
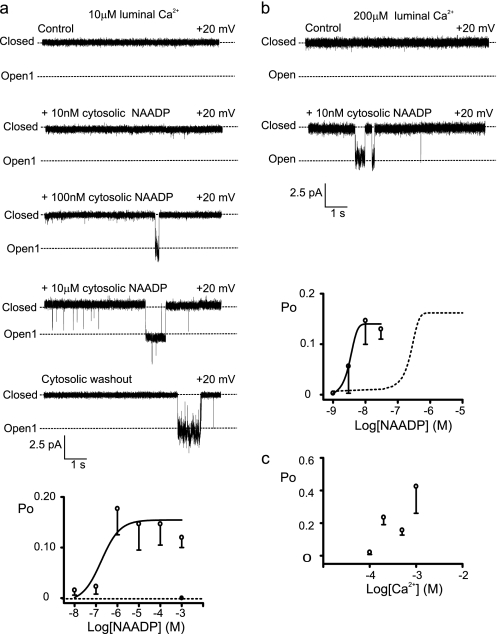
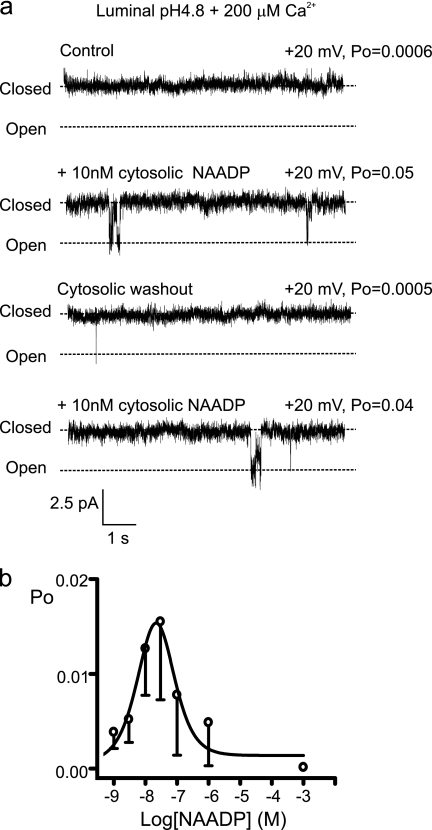
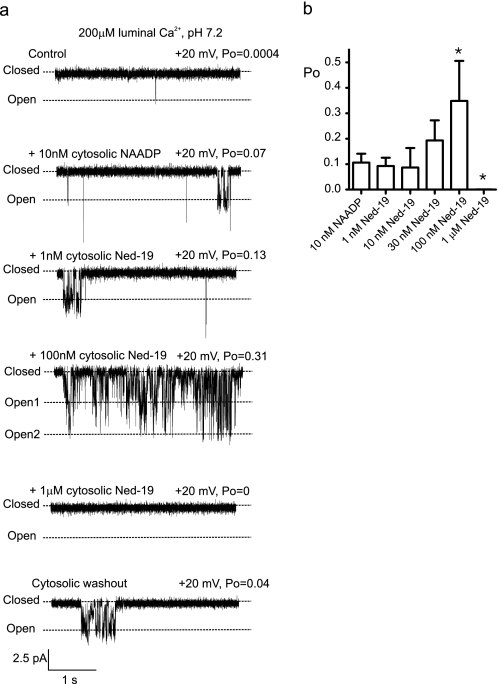
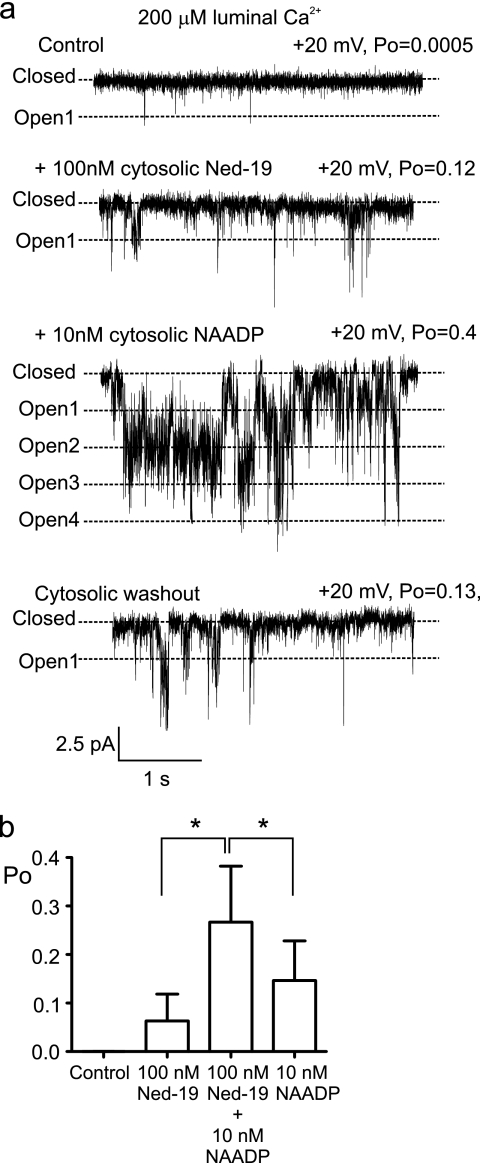
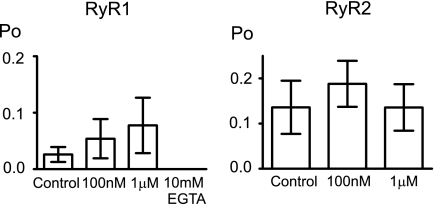
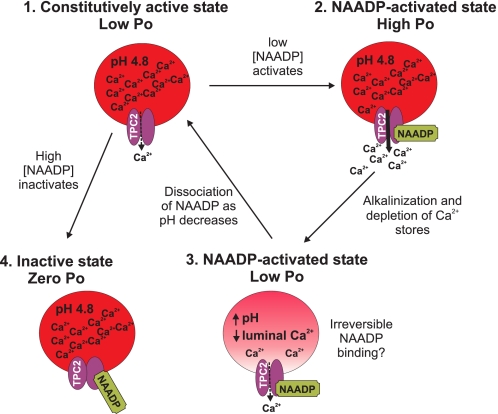
Nicotinic acid adenine dinucleotide phosphate (NAADP) is a molecule capable of initiating the release of intracellular Ca(2+) required for many essential cellular processes. Recent evidence links two-pore channels (TPCs) with NAADP-induced release of Ca(2+) from lysosome-like acidic organelles; however, there has been no direct demonstration that TPCs can act as NAADP-sensitive Ca(2+) release channels. Controversial evidence also proposes ryanodine receptors as the primary target of NAADP. We show that TPC2, the major lysosomal targeted isoform, is a cation channel with selectivity for Ca(2+) that will enable it to act as a Ca(2+) release channel in the cellular environment. NAADP opens TPC2 channels in a concentration-dependent manner, binding to high affinity activation and low affinity inhibition sites. At the core of this process is the luminal environment of the channel. The sensitivity of TPC2 to NAADP is steeply dependent on the luminal [Ca(2+)] allowing extremely low levels of NAADP to open the channel. In parallel, luminal pH controls NAADP affinity for TPC2 by switching from reversible activation of TPC2 at low pH to irreversible activation at neutral pH. Further evidence earmarking TPCs as the likely pathway for NAADP-induced intracellular Ca(2+) release is obtained from the use of Ned-19, the selective blocker of cellular NAADP-induced Ca(2+) release. Ned-19 antagonizes NAADP-activation of TPC2 in a non-competitive manner at 1 μM but potentiates NAADP activation at nanomolar concentrations. This single-channel study provides a long awaited molecular basis for the peculiar mechanistic features of NAADP signaling and a framework for understanding how NAADP can mediate key physiological events.


Figures

FIGURE 1.
FIGURE 1.
TPC2 is a functional ion channel activated by NAADP. a, anti-HA immunoblot of protein incorporated into bilayers. Sol corresponds to solubilized sample before IP, Specific corresponds to IP with anti-HsTPC2 serum, and Nonspecific corresponds to a control IP with non-immune rabbit serum. b and c, a typical single-channel experiment showing sequential additions of NAADP to the trans and cis chambers with K+ (b) or Ca2+ (c) as permeant ion. d and e, current-voltage relationships with K+ or Ca2+, respectively, as permeant ion. The dotted line in d illustrates the KCl gradient (trans, 210 mm; cis, 510 mm) data. f, the relative permeability of TPC2 to K+ and Ca2+. The single-channel current-voltage relationship with 210 mm KCl in the cis chamber and 210 mm CaCl2 in the trans chamber yields a reversal potential of 26 ± 1 mV (n = 3). The PCa2+/PK+ was calculated to be 2.6 ± 0.17. The bi-ionic conductance over the range −30 to +60 mV (22 ± 3 pS (n = 3)) is similar to that obtained using only Ca2+ as the permeant ion (15 ± 1.5 pS) as expected if Ca2+ is the ion predominantly flowing through the channel at potentials close to 0 mV.
FIGURE 2.
FIGURE 2.
Distinct gating characteristics of TPC2. a, the current-voltage relationship reveals a subconductance state that is 212 ± 12 pS (n = 5), ∼70% of the fully open channel level. As a direct comparison, the dotted line shows the current-voltage relationship of the fully open state (Fig. 1c). b, all-points amplitude histogram obtained from TPC2 single-channel current fluctuations obtained at +20 mV in symmetrical 210 mm KCl, pH 7.2. The histogram was best fit with a single Gaussian function and gave a mean single-channel current amplitude value of 4.3 ± 0.13 pA corresponding to the fully open channel level. We observed the subconductance gating state in all our recordings, yet because of the low incidence of occurrence, the subconductance state of TPC2 cannot be accurately detected with an amplitude histogram. c, a typical example of episodic coupled gating of multiple TPC2 channels. d, histogram showing the time dependence of NAADP activation. For this analysis, we used a very low [NAADP], essentially a threshold concentration at the foot of the concentration-response relationship (and therefore a concentration that does not activate all channels). This was to investigate whether, because of the irreversible effect of NAADP, Po might gradually increase over time following initial activation. The figure indicates that it does not gradually increase over time, although non-stationary gating behavior was very obvious (as reported for many other ion channels, for example, RyR2 (47)). The average time to onset under these conditions (10 nm NAADP, 10 μm luminal [Ca2+], pH 7.2) was 44 ± 10 s (n = 5).
FIGURE 3.
FIGURE 3.
Effects of NAADP and luminal Ca2+ on TPC2 gating. a, the upper panel shows a representative experiment showing sequential increases in [NAADP] using K+ as permeant ion followed by washout of NAADP from the cis chamber (bottom trace). The lower panel shows an NAADP concentration-response relationship. The addition of 1 mm NAADP without first pretreating with activating concentrations is shown by the filled circle (n = 4). Error bars represent mean ± S.D. (n ≥ 3). b, a typical experiment, using K+ as permeant ion, showing that in the presence of 200 μm luminal Ca2+, very low [NAADP] (10 nm) can activate TPC2. The lower panel shows an NAADP concentration-response relationship in the presence of 200 μm luminal Ca2+. The dashed curve shows the data from a as a comparison. c, the relationship between TPC2 Po and luminal [Ca2+] in the presence of 10 nm NAADP. Data are mean ± S.D. (n ≥ 3).
FIGURE 4.
FIGURE 4.
Luminal pH regulates TPC2. a, a representative experiment with K+ as the permeant ion in the presence of 200 μm luminal [Ca2+] at low luminal pH (4.8). 10 nm NAADP activates the channel (second trace). Washout of NAADP shows that NAADP binding is reversible, and subsequent addition of NAADP (10 nm) reopens the channel. b, Relationship between TPC2 Po and [NAADP] with K+ as the permeant ion, 200 μm luminal [Ca2+], luminal pH (4.8). Data are mean ± S.D. (n ≥ 3).
FIGURE 5.
FIGURE 5.
The slow onset of NAADP-induced TPC2 channel activation is concentration-dependent. The histogram monitors Po over time by breaking up the data into 200-ms segments. We used a high concentration of NAADP (10 μm) in the presence of 10 μm luminal [Ca2+], pH 7.2. The average time to onset was 14 ± 1 s (n = 3). This compares with 44 ± 10 s (n = 5; p < 0.05) under identical conditions when a very low, threshold concentration of NAADP was used (10 nm), as described in the legend for Fig. 2. The non-stationary or modal gating behavior is still operating at high [NAADP]. To investigate whether luminal factors affect the rate of onset of NAADP activation of TPC2, we again chose a very low, threshold level of NAADP. 10 nm NAADP is an optimally effective concentration in the presence of 200 μm luminal [Ca2+], so we used the threshold concentration of 1 nm NAADP. Average time to onset of activation was: (i) 50 ± 5 s (n = 3) for 1 nm NAADP with 200 μm luminal [Ca2+], pH 7.2; (ii) 41 ± 16 s (n = 3) for 1 nm NAADP with 200 μm luminal [Ca2+], pH 4.8. These results suggest that the luminal environment does not affect the rate of onset of NAADP-induced activation of TPC2, but a more detailed kinetic analysis will be needed for a better understanding of this phenomenon.
FIGURE 6.
FIGURE 6.
Effects of Ned-19 on TPC2. a, a typical experiment illustrating TPC2 channels gating in the bilayer in the presence of 200 μm luminal Ca2+ (K+ is the permeant ion), pH 7.2. Cytosolic NAADP (10 nm) followed by sequential increments in cytosolic Ned-19 levels was applied as indicated. Po values are shown above the relevant trace. The bottom trace shows the effect of washing out both compounds from the cis chamber; only the effects of Ned-19 are reversible. b, concentration dependence of Ned-19 effects in the presence of NAADP (*, p < 0.05).
FIGURE 7.
FIGURE 7.
Ned-19 potentiates the effects of NAADP at TPC2. a, Ned-19 can activate TPC2 in the absence of NAADP. A typical experiment is shown where Ned-19 (100 nm) activates TPC2 in the absence of NAADP. Subsequent addition of NAADP potentiates the effects of Ned-19 (further evidence that NAADP and Ned-19 do not compete for the same binding sites). Washout of cytosolic NAADP and Ned-19 (bottom trace) lowers Po but to a level higher than that of the control (top trace). This is because although Ned-19 binding to TPC2 is reversible, NAADP binding to TPC2 is irreversible. b, comparison of the individual and simultaneous effects of NAADP and Ned-19 on TPC2 Po (*, p < 0.05).
FIGURE 8.
FIGURE 8.
Effects of NAADP on RyR. Histograms showing the effect of NAADP on RyR1 and RyR2 with Ca2+ as the permeant ion (mean ± S.D.; n ≥ 3) are displayed. The Ca2+ sensitivity of RyR1 was checked at the end of the experiment by lowering the cytosolic [Ca2+] to subactivating levels (<1 nm free Ca2+) with 10 mm cytosolic EGTA. All channel openings were abolished (Po = 0; n = 3). In separate bilayer experiments with RyR2 channels from the same preparations as those used in the histogram, the Ca2+ sensitivity was also confirmed with EGTA (10 mm).
FIGURE 9.
FIGURE 9.
Model summarizing NAADP modulation of TPC2 channel gating. Without NAADP present, TPC2 Po is very low, but it still gates with occasional brief openings, and therefore, it is in a constitutively active state (1). Low [NAADP] increases Po to optimum levels when Ca2+ loading of the stores is high (2). Ca2+ release depletes the stores of Ca2+, leading to a reduced Po, but causes alkalinization within the stores, which could lead to irreversible binding of NAADP to TPC2 (3). Both state (2) and state (3) represent NAADP-activated states. As the acidic pH is restored, NAADP dissociates from TPC2, and luminal Ca2+ stores are replenished. High [NAADP] inactivates the channel (Po = 0) in a reversible manner (4); we term this state the inactive state.

References

    1. Lee H. C., Aarhus R. (1995) J. Biol. Chem. 270, 2152–2157 - PubMed
    1. Lee H. C. (2000) J. Membr. Biol. 173, 1–8 - PubMed
    1. Genazzani A. A., Galione A. (1997) Trends Pharmacol. Sci. 18, 108–110 - PubMed
    1. Guse A. H. (2009) Curr. Biol. 19, R521–R523 - PubMed
    1. Patel S., Churchill G. C., Galione A. (2001) Trends Biochem. Sci. 26, 482–489 - PubMed

Publication types

MeSH terms

LinkOut - more resources