

Performance of version 2.0 of the Cobas AmpliPrep/Cobas TaqMan real-time PCR assay for hepatitis B virus DNA quantification
- PMID: 20720031
- PMCID: PMC2953086
- DOI: 10.1128/JCM.01306-10
Performance of version 2.0 of the Cobas AmpliPrep/Cobas TaqMan real-time PCR assay for hepatitis B virus DNA quantification
Abstract
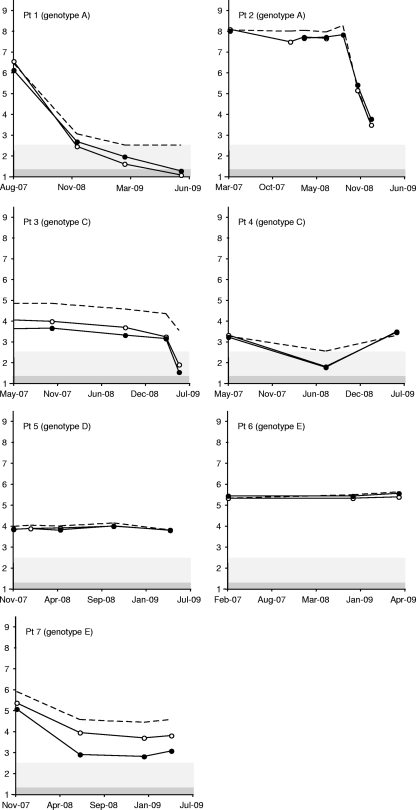
The detection and quantification of hepatitis B virus (HBV) DNA are essential for the diagnosis and treatment of chronic HBV infection. The use of real-time PCR assays for HBV DNA quantification is strongly recommended. The goal of this study was to evaluate the intrinsic characteristics and clinical performance of version 2.0 (v2.0) of the Cobas AmpliPrep/Cobas TaqMan (CAP/CTM) assay, a fully automated platform for HBV DNA quantification in serum or in plasma with a claimed lower limit of detection of 20 IU/ml and a claimed upper limit of quantification of 1.7 × 10(8) IU/ml. The specificity of the assay was 99% (95% confidence interval, 94.7 to 100%). Intra-assay and interassay coefficients of variation ranged from 0.21% to 2.67% and from 0.65% to 2.25%, respectively. The calibration of the assay was found to be satisfactory. Study of blood specimens from patients infected with HBV genotypes A to F showed good correspondence between HBV DNA levels measured by the CAP/CTM v2.0 assay, version 1.0 of the same assay, and the third-generation "branched DNA" assay. The CAP/CTM v2.0 assay quantified HBV DNA levels in serum or plasma from the same patients equally. In conclusion, the new version of the CAP/CTM assay is sensitive, specific, and reproducible. It accurately quantifies HBV DNA levels in patients chronically infected with HBV genotypes A to F. Improvements made to ensure equal quantification of HBV DNA in serum and plasma have been successful. Overall, the CAP/CTM assay, version 2.0, is well suited to monitoring clinical HBV DNA levels according to current clinical practice guidelines.
Figures


Similar articles
-
Performance of the Cobas AmpliPrep/Cobas TaqMan real-time PCR assay for hepatitis B virus DNA quantification.J Clin Microbiol. 2008 May;46(5):1716-23. doi: 10.1128/JCM.01248-07. Epub 2008 Feb 20. J Clin Microbiol. 2008. PMID: 18287319 Free PMC article.
-
Evaluation of the COBAS AmpliPrep-total nucleic acid isolation-COBAS TaqMan hepatitis B virus (HBV) quantitative test and comparison to the VERSANT HBV DNA 3.0 assay.J Clin Microbiol. 2006 Apr;44(4):1390-9. doi: 10.1128/JCM.44.4.1390-1399.2006. J Clin Microbiol. 2006. PMID: 16597867 Free PMC article.
-
Detection and quantitation of HBV DNA in miniaturized samples: multi centre study to evaluate the performance of the COBAS ® AmpliPrep/COBAS ® TaqMan ® hepatitis B virus (HBV) test v2.0 by the use of plasma or serum specimens.J Virol Methods. 2010 Nov;169(2):404-8. doi: 10.1016/j.jviromet.2010.07.025. Epub 2010 Aug 20. J Virol Methods. 2010. PMID: 20728470
-
COBAS AmpliPrep-COBAS TaqMan hepatitis B virus (HBV) test: a novel automated real-time PCR assay for quantification of HBV DNA in plasma.J Clin Microbiol. 2007 Mar;45(3):828-34. doi: 10.1128/JCM.00914-06. Epub 2007 Jan 17. J Clin Microbiol. 2007. PMID: 17229858 Free PMC article.
-
Comparison of the QIAGEN artus HBV QS-RGQ Assay With the Roche COBAS AmpliPrep/COBAS TaqMan HBV Assay for Quantifying Viral DNA in Sera of Chronic Hepatitis B Patients.Ann Lab Med. 2017 May;37(3):248-253. doi: 10.3343/alm.2017.37.3.248. Ann Lab Med. 2017. PMID: 28224771 Free PMC article.
Cited by
-
Diagnosis and Monitoring of Hepatitis B Virus Infection Using the Cobas® HBV Test for Use on the Cobas® 4800 System.Microorganisms. 2021 Mar 11;9(3):573. doi: 10.3390/microorganisms9030573. Microorganisms. 2021. PMID: 33799562 Free PMC article.
-
Analysis of baseline hepatitis B virus DNA levels in chronic hepatitis B patients with non-hematological malignancies prior to the initiation of cancer chemotherapy.Mol Clin Oncol. 2016 Jul;5(1):165-170. doi: 10.3892/mco.2016.857. Epub 2016 Apr 14. Mol Clin Oncol. 2016. PMID: 27330792 Free PMC article.
-
Comparison of the Amplisure HBV Quantitative Kit with the Qiagen Artus HBV QS-RGQ Assay for Quantifying Viral DNA in Plasma Samples of Monitoring Cases.Intervirology. 2021;64(4):178-184. doi: 10.1159/000515905. Epub 2021 May 21. Intervirology. 2021. PMID: 34023832 Free PMC article.
-
Rapid quantification assay of hepatitis B virus DNA in human serum and plasma by Fully Automated Genetic Analyzer μTASWako g1.PLoS One. 2023 Feb 9;18(2):e0278143. doi: 10.1371/journal.pone.0278143. eCollection 2023. PLoS One. 2023. PMID: 36758029 Free PMC article.
-
Enhancement of PCR Detection Limit by Single-Tube Restriction Endonuclease-PCR (RE-PCR).Mol Diagn Ther. 2016 Jun;20(3):297-305. doi: 10.1007/s40291-016-0195-2. Mol Diagn Ther. 2016. PMID: 26993322
References
-
- Chevaliez, S., M. Bouvier-Alias, R. Brillet, and J. M. Pawlotsky. 2007. Overestimation and underestimation of hepatitis C virus RNA levels in a widely used real-time polymerase chain reaction-based method. Hepatology 46:22-31. - PubMed
-
- Chevaliez, S., and J. M. Pawlotsky. 2008. Diagnosis and management of chronic viral hepatitis: antigens, antibodies and viral genomes. Best Pract. Res. Clin. Gastroenterol. 22:1031-1048. - PubMed
-
- European Association for the Study of the Liver. 2009. EASL Clinical Practice Guidelines: management of chronic hepatitis B. J. Hepatol. 50:227-242. - PubMed
-
- Fattovich, G., F. Bortolotti, and F. Donato. 2008. Natural history of chronic hepatitis B: special emphasis on disease progression and prognostic factors. J. Hepatol. 48:335-352. - PubMed
Publication types
MeSH terms
Substances
LinkOut - more resources
Full Text Sources
Miscellaneous
