. 2010 Aug 18;30(33):10953-66.
doi: 10.1523/JNEUROSCI.0486-10.2010.

Ectopic Reelin induces neuronal aggregation with a normal birthdate-dependent "inside-out" alignment in the developing neocortex

Affiliations

Ectopic Reelin induces neuronal aggregation with a normal birthdate-dependent "inside-out" alignment in the developing neocortex

Ken-ichiro Kubo et al. J Neurosci. .

Abstract

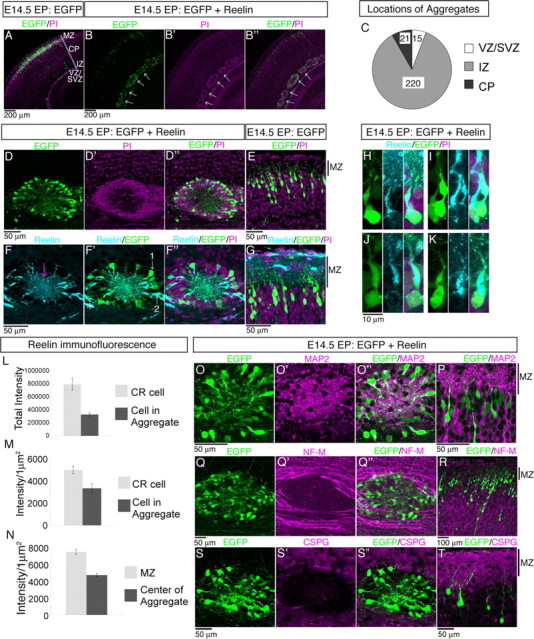
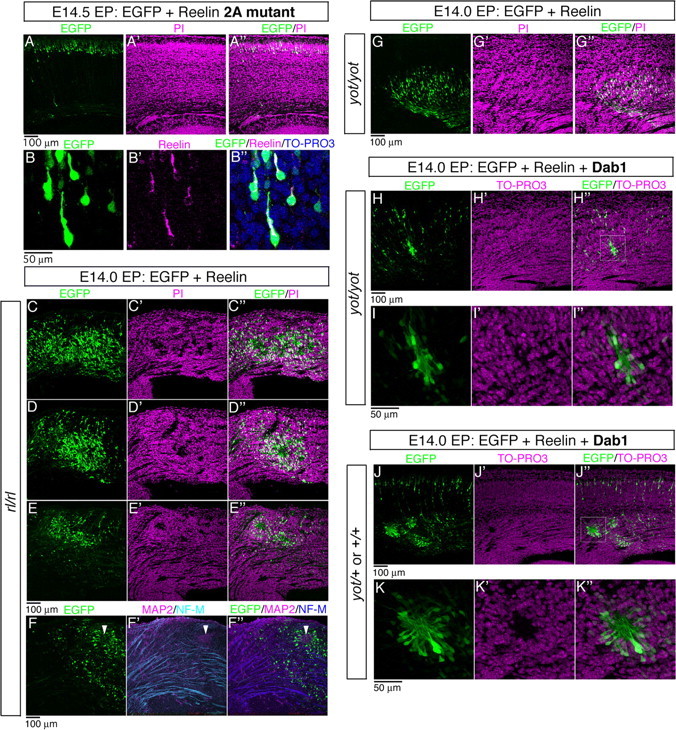
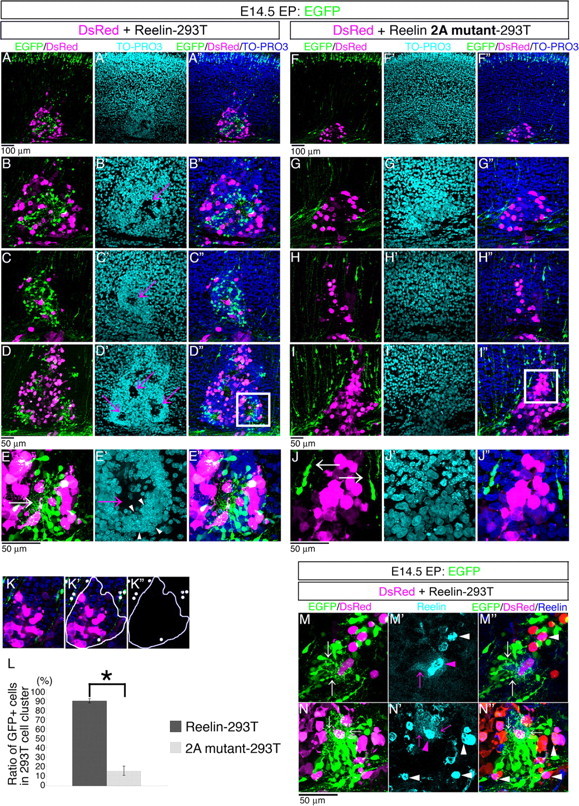
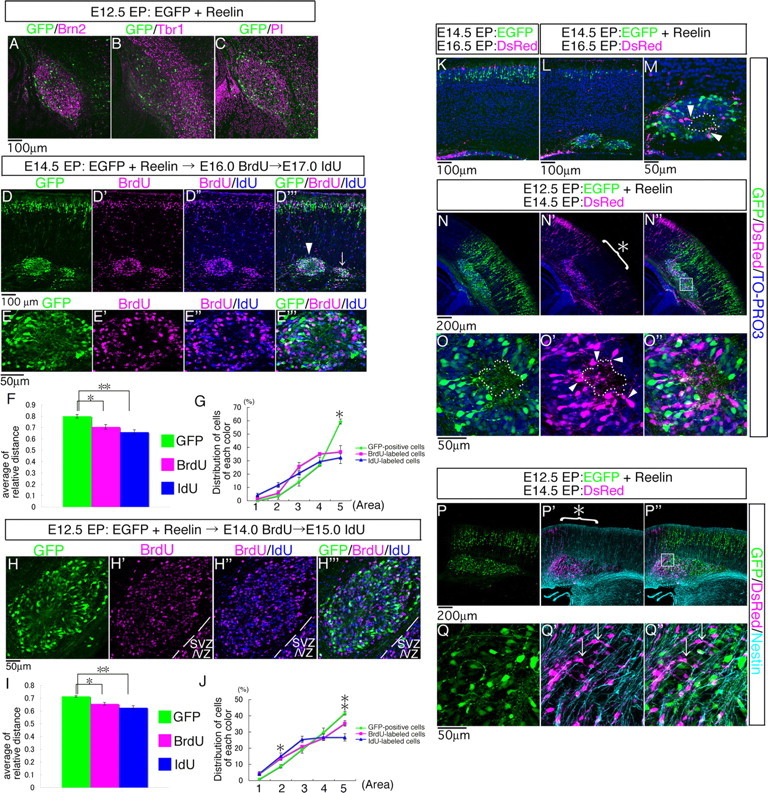
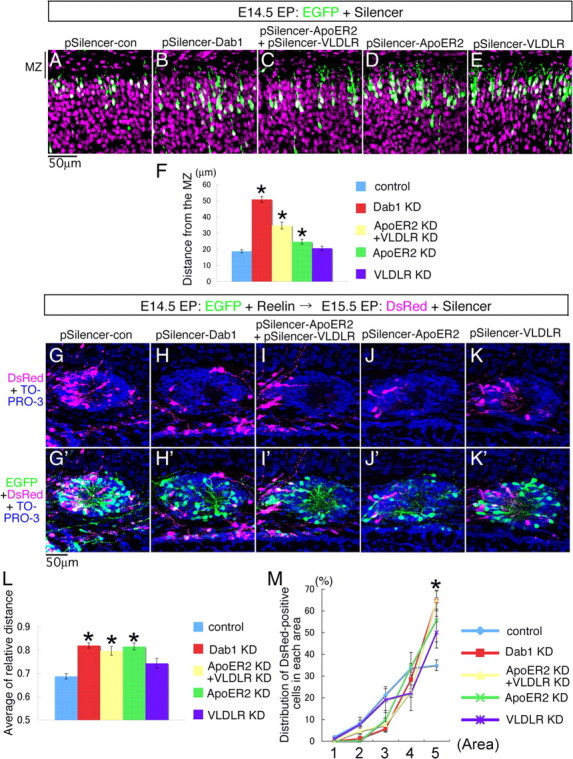
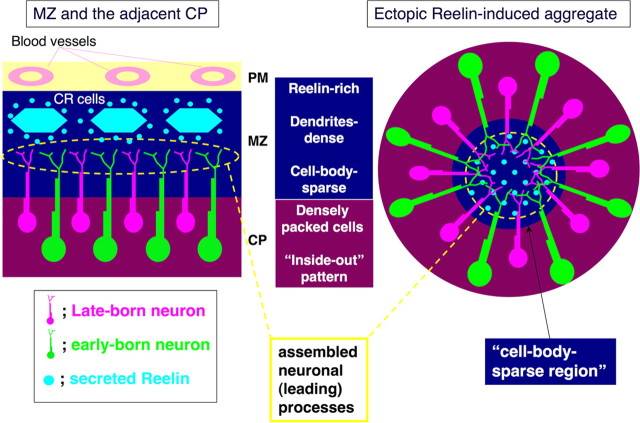
Neurons in the developing mammalian neocortex form the cortical plate (CP) in an "inside-out" manner; that is, earlier-born neurons form the deeper layers, whereas later-born neurons migrate past the existing layers and form the more superficial layers. Reelin, a glycoprotein secreted by Cajal-Retzius neurons in the marginal zone (MZ), is crucial for this "inside-out" layering, because the layers are inverted in the Reelin-deficient mouse, reeler (Reln(rl)). Even though more than a decade has passed since the discovery of reelin, the biological effect of Reelin on individual migrating neurons remains unclear. In addition, although the MZ is missing in the reeler cortex, it is unknown whether Reelin directly regulates the development of the cell-body-sparse MZ. To address these issues, we expressed Reelin ectopically in the developing mouse cortex, and the results showed that Reelin caused the leading processes of migrating neurons to assemble in the Reelin-rich region, which in turn induced their cell bodies to form cellular aggregates around Reelin. Interestingly, the ectopic Reelin-rich region became cell-body-sparse and dendrite-rich, resembling the MZ, and the late-born neurons migrated past their predecessors toward the central Reelin-rich region within the aggregates, resulting in a birthdate-dependent "inside-out" alignment even ectopically. Reelin receptors and intracellular adaptor protein Dab1 were found to be necessary for formation of the aggregates. The above findings indicate that Reelin signaling is capable of inducing the formation of the dendrite-rich, cell-body-sparse MZ and a birthdate-dependent "inside-out" alignment of neurons independently of other factors/structures near the MZ.


Figures

Figure 1.
Figure 1.
Ectopic overexpression of Reelin induces cell aggregation. A, A P1.5 brain that had been transfected with a GFP plasmid at E14.5. B–B″, Aggregates of GFP-positive cells (green) had formed in the IZ of the P1.5 neocortex (white arrows) transfected with both a Reelin expression vector and a GFP plasmid at E14.5. C, Of the 256 Reelin-induced aggregates that formed in 114 brains, 220 were located in the IZ, 21 in the CP, and 15 in the VZ/SVZ. No aggregates had formed in the MZ. D–D″, Higher magnifications of an aggregate. E, MZ of a P1.5 brain transfected with a GFP plasmid at E14.5. A, B′, B″, D′, D″, E, Sections stained with propidium iodide (PI). F–G, Immunostained aggregate (F–F″) and a P1.5 brain transfected with a GFP plasmid at E14.5 (G) stained with CR50 antibody (cyan) and with PI (magenta, F″ and G). The neurons indicated by arrows 1 and 2 in F′ are magnified in H and I, respectively. Asterisk in F′ points to nonspecific staining. H–K, Higher magnifications of GFP and Reelin-positive cells in the aggregates. Reelin immunofluorescence is weak in the trailing part of the cell bodies. L–N, Quantifications of the Reelin immunofluorescence intensities are shown. L, Means ± SEs of the total Reelin immunofluorescence intensity of the CR cells (n = 5) and the cells in the aggregates (n = 5) are shown. M, Means ± SEs of Reelin immunofluorescence intensity per 1 μm2 of the CR cells (n = 5) and the cells in the aggregates (n = 5). N, Reelin immunofluorescence intensity was measured in the extracellular space in the MZ or in the cell-body-sparse centers of the aggregates. Means ± SEs are shown (n = 5, respectively). O–O″, Q–Q″, S–S″, Aggregate immunostained with antibodies to the somatodendritic marker MAP-2 (O–O″), the axonal marker neurofilament (NF)-M (Q–Q″), and chondroitin sulfate proteoglycan (CSPG, S–S″) are shown. P, R, T, Superficial region of the cortex including the MZ immunostained with anti-MAP-2 (P), anti-NF-M (R), and anti-CSPG (T).
Figure 2.
Figure 2.
Reelin binding to its receptors and the presence of intracellular adaptor protein Dab1 are essential for the ectopic aggregation to occur. A–B″, Reelin binding to its receptors is required for aggregate formation. A–A″, An expression vector for the Reelin 2A mutant, in which two lysine residues critical for receptor binding by Reelin are mutated to alanines (2A mutant), and a GFP plasmid were electroporated into the cortex at E14.5. Brains were fixed at P1.5, 6 d after electroporation, and sections were counterstained with PI. Overexpression of the 2A mutant did not prevent the migration of cortical cells or induce the formation of aggregates (in 12 ICR mice brains). B–B″, Sections of the cortex that had been transfected with the 2A mutant were stained with anti-Reelin antibody (magenta, B′ and B″) and TO-PRO-3 iodide (blue, B″). The GFP-positive cells (green, B and B″) were also labeled with an Reelin antibody (G10), indicating that the mutant Reelin protein was expressed by the migrating cells (B′ and B″). B″, A merged image is shown. C–F″, Ectopic expression of Reelin induced the formation of MAP-2-positive aggregates in reeler brains. C–E″, A Reelin expression vector and a GFP plasmid were cotransfected into the cortices of reeler embryos at E14.0, and the brains were examined at E18.0. Staining with PI (magenta) revealed that aggregates with cell-body-sparse regions had formed in the cortices of reeler (in 7 reeler brains). In contrast to the aggregates that usually form in the IZ of normal brains, aggregates were found in various locations in the disorganized reeler cortices. F–F″, An aggregate in the reeler cortex stained with anti-MAP-2 (magenta) and anti-NF-M (cyan or blue) antibodies. Although NF-M-positive axonal bundles are present in reeler cortices, the aggregate that formed was poor in NF-M-positive fibers and was positive for MAP-2 (arrowheads). G–K″, Ectopic expression of Reelin did not result in the formation of aggregates in yotari brains, but coexpression of Dab1 caused small aggregates to form. G–G″, A Reelin expression vector and a GFP plasmid were cotransfected into the cortices of yotari embryos at E14.0, and the brains were examined at E18.0. Sections were stained with PI (magenta). No clear aggregation was induced (in 6 yotari brains). H–I″, In addition to a Reelin expression vector and a GFP plasmid, a Dab1 expression vector was cotransfected into the cortices of yotari embryos at E14.0, and the brains were examined at E18.0. Sections were stained with TO-PRO3 (magenta). Aggregates had formed in three yotari brains. I–I″, Higher magnifications of an aggregate (square in H″) are shown. J–K″, Cotransfection of a GFP plasmid, a Reelin expression vector, and a Dab1 expression vector into the cortices of heterozygous or normal littermates of yotari embryos resulted in the formation of aggregates that were indistinguishable from the aggregates that formed in the absence of transfection with the Dab1 expression vector (in 5 brains). Sections were stained with TO-PRO3 (magenta). K–K″, Higher magnifications of an aggregate (square in J″) are shown.
Figure 3.
Figure 3.
Migrating neurons direct their processes toward Reelin in vivo. A–A″, Migrating neurons were labeled with GFP (green) at E14.5, and 293T cells expressing Reelin and/or DsRed (magenta) were transplanted at E16.5. The cell cluster is magnified in B–B″. B–D″, A large number of GFP-positive neurons had been incorporated into the clusters of Reelin-transfected 293T cells, and cell-body-sparse regions filled with GFP-labeled processes had formed (magenta arrows in B′, C′, and D′) in the clusters of 293T cells. E–E″, Higher magnifications of the square in D″ are shown. The cell-body-sparse region was accompanied by a densely packed neuronal cell-body-rich area (white arrowheads). F–F″, Migrating neurons were labeled with GFP (green) at E14.5, and 293T cells expressing the 2A mutant of Reelin and/or DsRed (magenta) were transplanted at E16.5. The cell cluster is magnified in G–G″. G–I″, The 2A mutant of Reelin- and/or DsRed-transfected control 293T cells contained few GFP-positive migrating neurons. J–J″, Higher magnifications of the square in I″ are shown. Migrating cells extended their leading processes toward the pial surface normally (J, arrows). K–K″, An example of the analysis of the distribution of GFP-positive cells in the rectangles enclosing the lines drawn around the clusters of transplanted 293T cells. In this case (2A mutant of Reelin was transfected), a single GFP-positive cell was localized within the cluster. L, Means ± SEs of data obtained from five brains are shown. A significantly higher proportion of GFP-positive cells was caught inside the Reelin-producing 293T cell clusters than in the controls (*p < 0.01, Student's t test). The numbers of counted cells were 109 (2A mutant of Reelin-293T) and 507 (Reelin-293T). M, N, The processes (white arrows) of GFP-positive migrating neurons assembled around some 293T cells. M′, N′, Immunostaining with CR50 antibody revealed that the Reelin-transfected 293T cells (magenta arrowheads) had secreted Reelin into the surrounding area (magenta arrows). Although the 293T cells indicated by the white arrowheads also expressed Reelin, hardly any extracellular Reelin signal was detected around them. N–N″, This section was adjacent to the section in E–E″.
Figure 4.
Figure 4.
Reelin allows late-born neurons to migrate past their predecessors in the Reelin-induced cell aggregates. A–C, The laminar organization of the cells composing the aggregates was examined. GFP plasmid and Reelin expression vector were coelectroporated at E12.5, and the brains were fixed at P1.5. Staining with anti-Brn2 (A, magenta), anti-Tbr1 (B, magenta), or PI (C, magenta). D–J, GFP plasmid plus a Reelin expression vector was electroporated at E14.5, and BrdU and IdU were injected at E16.0 and E17.0, respectively (D–G), or the plasmid plus vector was electroporated at E12.5, and BrdU and IdU were injected at E14.0 and E15.0, respectively (H–J). Higher magnifications of the aggregate in D‴ (arrowhead) are shown in E–E‴. The periphery of another aggregate is indicated by an arrow in D‴. The aggregates were stained at P1.5 with a specific antibody for BrdU (E′, H′) and an antibody that recognizes both BrdU and IdU (E″, H″). The broken lines in H′–H‴ represent the boundary between the IZ and SVZ/VZ. F, I, The average relative distances of GFP-positive cells, BrdU-labeled cells, and IdU-labeled cells (blue single-positive cells in E″ and H″) from the center of the aggregate were calculated. The means ± SEs of the averages of the relative distances (F, 3 aggregates from 3 different brains; I, 4 from 4) are shown. **p < 0.01, *p < 0.05, according to the Tukey–Kramer test. G, J, The ratios of the number of cells of each color in each area to the number of cells of the same color in the entire aggregate were calculated. The means ± SEs of the ratios in each area (G, 3 aggregates from 3 different brains; J, 4 from 4) are shown. Asterisks indicate significant differences between the ratios of cells of different colors according to the Tukey–Kramer test [* in G: green vs magenta, p < 0.05; green vs blue, p < 0.01; * in J (area 2): green vs blue, p < 0.05; and ** in J (area 5): green vs blue, p < 0.01; magenta vs blue, p < 0.05]. K–M, Sequential electroporations of different markers were performed at successive stages of development. GFP plasmid without (K) or with (L–Q″) Reelin expression vector was coelectroporated at E14.5 (K–M) or E12.5 (N–Q″), and a DsRed plasmid was electroporated at E16.5 (K–M) or E14.5 (N–Q″). The brains were fixed at P4.5 (K–M) or P 1.5 (N–Q″). Sections were counterstained with TO-PRO-3 iodide (blue, K–O″) or stained with anti-nestin antibody (cyan, P′, P″, Q′, Q″). Higher magnifications of L and the square in N″ are shown in M and O–O″, respectively. The same as the GFP-positive cells, the DsRed-positive cells oriented their processes (indicated by white arrowheads) toward the cell-body-sparse regions (demarcated by a white doted line). Q–Q″, Higher magnification of the square in P″. The course of the processes of the DsRed-positive cells caught in the aggregates was almost perpendicular to the radial fibers (arrows in Q′ and Q″). Asterisks in N′ and P′, Few DsRed-positive cells migrated into the CP above the aggregate, and most of them terminated their migration within the aggregates in the IZ.
Figure 5.
Figure 5.
Migrating neurons passed their predecessors in a Reelin-signaling-dependent manner. A, B, D, E, A P0.5 brain that had been transfected with a GFP plasmid plus a control RNAi plasmid (at a concentration of 5 mg/ml, pSilencer-con, control) or an RNAi plasmid that target Dab1 (pSilencer-Dab1, Dab1 KD), VLDLR (pSilencer-VLDLR, VLDLR KD), or ApoER2 (pSilencer-ApoER2, ApoER2 KD) at E14.5. C, The E14.5 brain was transfected with a GFP plasmid plus pSilencer-VLDLR (at a concentration of 2.5 mg/ml) and pSilencer-ApoER2 (2.5 mg/ml) (ApoER2 KD + VLDLR KD). Sections were counterstained with PI (magenta, A–E). F, The means ± SEs of the distances of GFP-positive cells from the lower borders of the MZ in four brains are shown. *p < 0.01, according to the Tukey–Kramer test. G–M, GFP plasmid with Reelin expression vector was coelectroporated at E14.5, and a DsRed plasmid plus one or two RNAi plasmids was electroporated at E15.5. The brains were fixed at P 1.5. Sections were counterstained with TO-PRO-3 iodide (blue, G–K). G′–K′, Merged images. L, The means ± SEs of the relative distances of DsRed-positive (later-born) cells from the centers of five aggregates in five different brains are shown. The number of DsRed-positive cells counted in sections of brains transfected with control, Dab1 KD, ApoER2 KD + VLDLR KD, ApoER2 KD, and VLDLR KD plasmids were 312, 162, 82, 55, and 90, respectively. *p < 0.01, according to the Tukey–Kramer test. M, The distribution of DsRed-positive cells was evaluated by counting the cells in each of five regions produced by dividing each aggregate into concentric areas (areas 1–5, with area 1 being the most central region). The ratio of the number of cells in each area to the total number of cells in the entire aggregate was calculated. The means ± SEs of the ratios in five aggregates in five different brains are shown. *Significant difference between the control and Dab1 KD, between the control and ApoER2 KD + VLDLR KD, both p < 0.05, according to the Tukey–Kramer test.
Figure 6.
Figure 6.
Time-lapse imaging of the developing aggregates. A, Time-lapse images were obtained from a cortical slice prepared at E17.5 that had been electroporated with a GFP plasmid and a Reelin expression vector at E14.5. A migrating neuron with a thin leading process (green arrows) moved into the aggregate. See also supplemental Movie 1 (available at www.jneurosci.org as supplemental material). B, The images of another newly joining migrating neuron. The leading process (magenta arrows) grew shorter, and the cell body approached the aggregate. See also supplemental Movie 2 (available at www.jneurosci.org as supplemental material). C–E, Time-lapse images were obtained from a cortical slice prepared at E16.5 that had been electroporated with a GFP plasmid plus a Reelin expression vector at E13.5, and with a DsRed plasmid at E14.5. C, Fluorescent images of the GFP-positive cells are shown. A small cluster of GFP-positive cells (white) was noted at the start of the observation (magenta arrowheads). A number of other GFP-positive cells joined the aggregate from the surrounding area [green arrows (a–c)]. During the observation period (especially after the sixth panel indicated by the time 8:44), the size of the GFP-positive aggregate gradually increased. The margin of the expanded GFP-positive aggregate is indicated by green arrowheads in the last panel. The cell indicated by the white arrow is magnified in D. See also supplemental Movie 3 (available at www.jneurosci.org as supplemental material). D, Enlarged images of the GFP-positive cell indicated by the white arrow in C (marked with magenta stars). The tiny processes (arrows) of a round cell frequently moved, but then a single process became prominent and grew (arrowheads). See also supplemental Movie 4 (available at www.jneurosci.org as supplemental material). E, Images of the DsRed-positive cells (magenta) were merged with the images in C. DsRed-positive cells [e.g., cyan arrows (d, e)] joined the GFP-positive aggregate, resulting in the arrangement of the late-born DsRed-positive cells (cyan arrowheads in the last panel) further inside than the cell bodies of the GFP-positive cells. The green arrowheads in C are also shown. See also supplemental Movie 5 (available at www.jneurosci.org as supplemental material). F, Schematic representation of formation of an aggregate. 1, A small GFP-positive aggregate has formed. 2, A newly joining migrating neuron has extended its leading process and is moving toward the aggregate. 3, The cell bodies of the GFP-positive cells (green) have moved outward. 4, The late-born cells (magenta) are migrating over the cell bodies of the GFP-positive cells. 5, Nonlabeled late-born cells (depicted in gray) are also assumed to have participated in the formation of the aggregate. 6, The late-born cells are arranged on the inside of the GFP-positive aggregate. The time displayed in each panel indicates the time (hours and minutes) elapsed since the start of the observation period. Top, The CP side; bottom, the ventricular side.
Figure 7.
Figure 7.
Reelin is capable of inducing “mini-cortex”-like structures. Reelin alone is capable of inducing the events that mimic those that normally occur in or beneath the MZ. The same as in the MZ, leading processes amassed in Reelin-rich areas where cell bodies are excluded. Adjacent regions are packed with the cell bodies of late-born cells that do not express Reelin as well as Reelin-expressing cells. Reelin-induced cell aggregates exhibit an “inside-out” cell arrangement, that is, later-born cells had migrated past their predecessors in the aggregates, resulting in the characteristic layering pattern of the neocortex. PM, Pia mater.

Similar articles

Cited by

References

    1. Ajioka I, Nakajima K. Birth-date-dependent segregation of the mouse cerebral cortical neurons in reaggregation cultures. Eur J Neurosci. 2005;22:331–342. - PubMed
    1. Bayer SA, Altman J. Neocortical development. New York: Raven; 1991.
    1. Caviness VS., Jr Neocortical histogenesis in normal and reeler mice: a developmental study based upon [3H]thymidine autoradiography. Brain Res. 1982;256:293–302. - PubMed
    1. Caviness VS, Jr, Sidman RL. Time of origin or corresponding cell classes in the cerebral cortex of normal and reeler mutant mice: an autoradiographic analysis. J Comp Neurol. 1973;148:141–151. - PubMed
    1. Cooper JA. A mechanism for inside-out lamination in the neocortex. Trends Neurosci. 2008;31:113–119. - PubMed

Publication types

MeSH terms

LinkOut - more resources