. 2010 Aug 18;30(33):11043-56.
doi: 10.1523/JNEUROSCI.1682-10.2010.

Role of aberrant striatal dopamine D1 receptor/cAMP/protein kinase A/DARPP32 signaling in the paradoxical calming effect of amphetamine

Affiliations

Role of aberrant striatal dopamine D1 receptor/cAMP/protein kinase A/DARPP32 signaling in the paradoxical calming effect of amphetamine

Francesco Napolitano et al. J Neurosci. .

Abstract

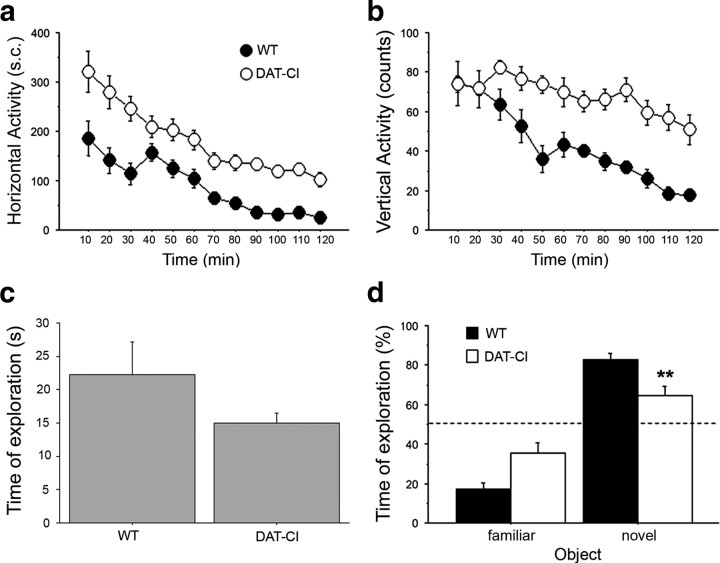
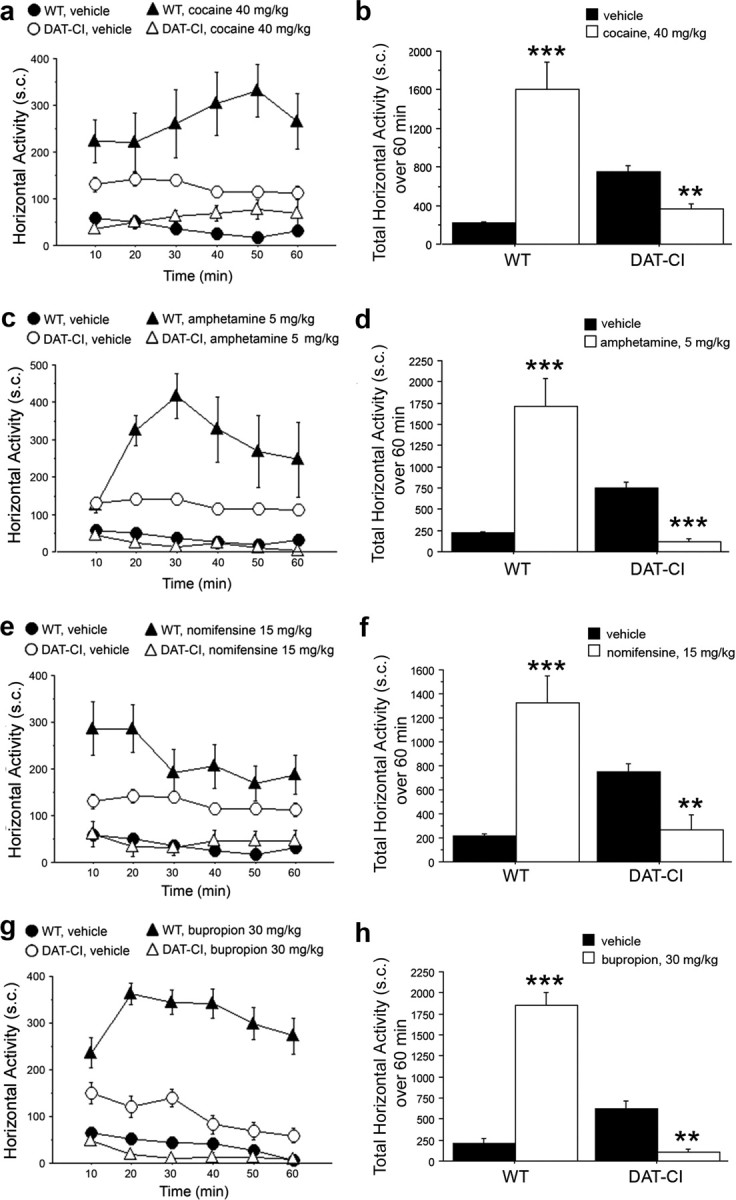
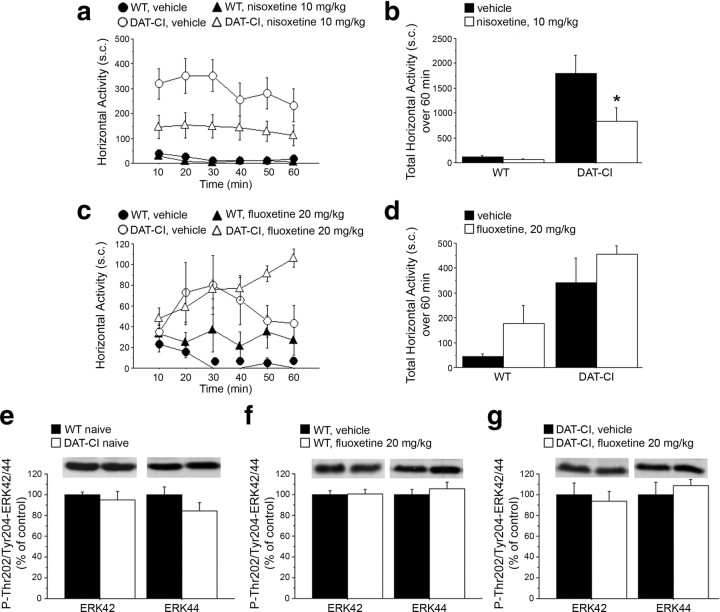
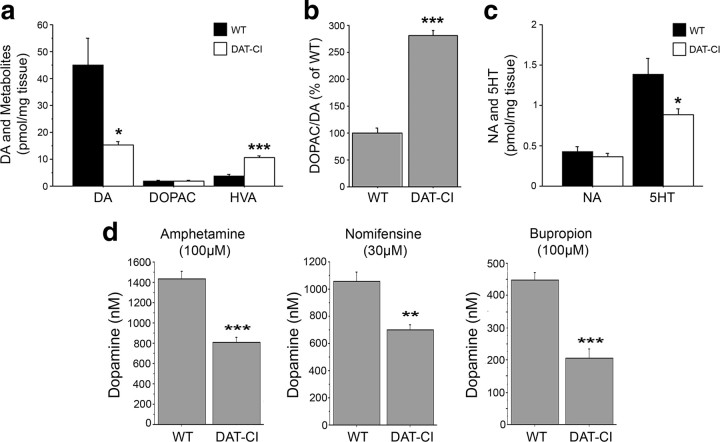
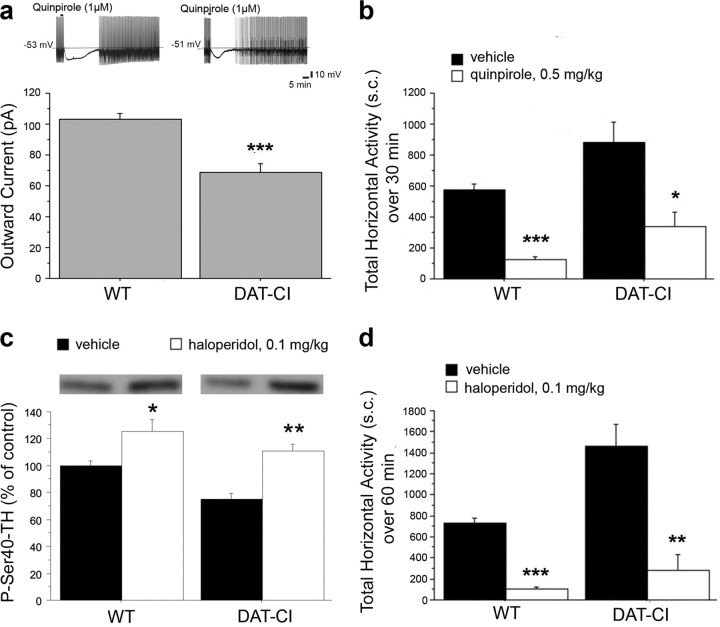
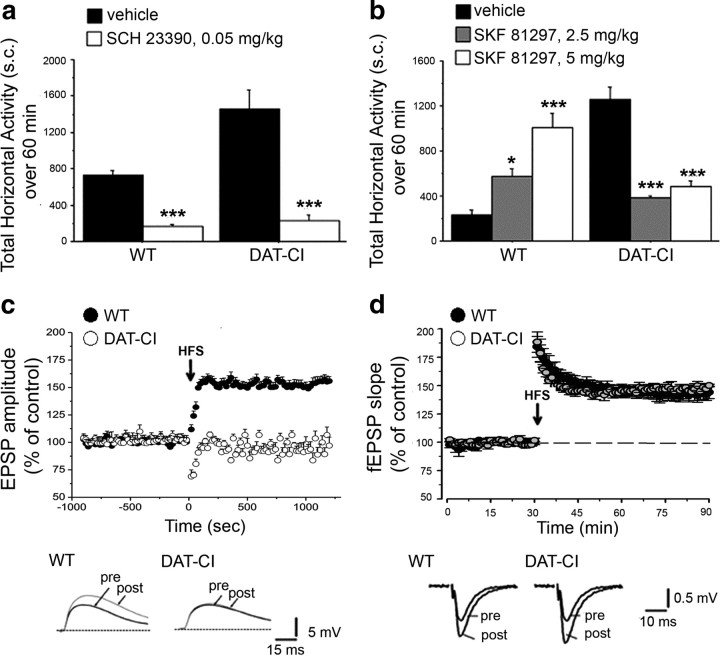
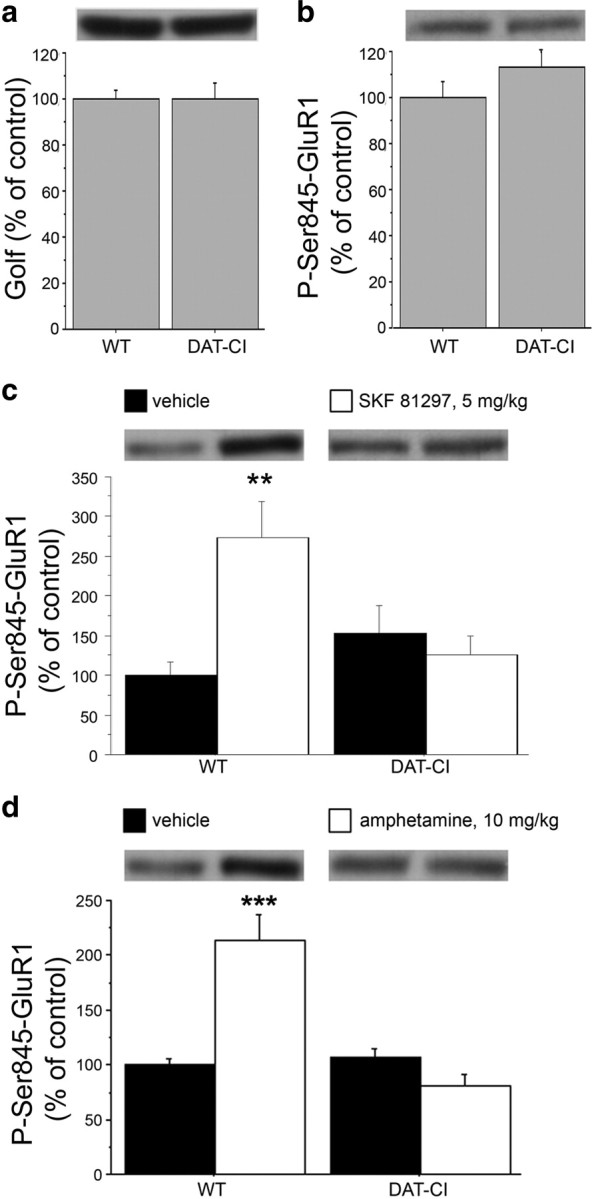
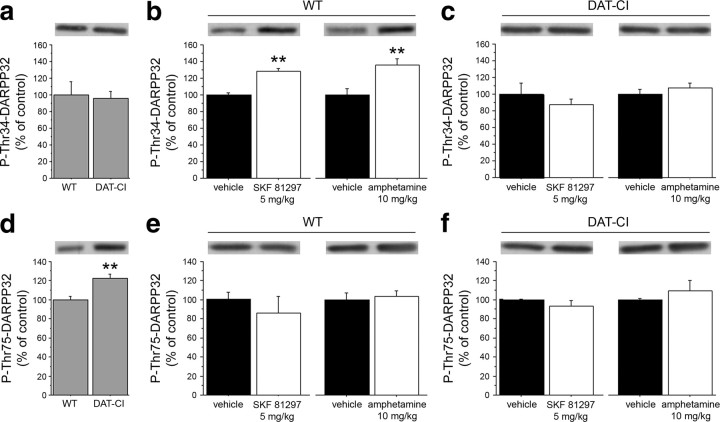
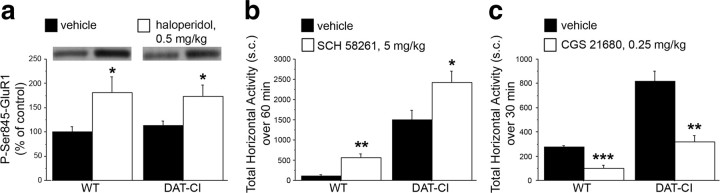
Attention deficit/hyperactivity disorder (ADHD) is characterized by inattention, impulsivity, and motor hyperactivity. Several lines of research support a crucial role for the dopamine transporter (DAT) gene in this psychiatric disease. Consistently, the most commonly prescribed medications in ADHD treatment are stimulant drugs, known to preferentially act on DAT. Recently, a knock-in mouse [DAT-cocaine insensitive (DAT-CI)] has been generated carrying a cocaine-insensitive DAT that is functional but with reduced dopamine uptake function. DAT-CI mutants display enhanced striatal extracellular dopamine levels and basal motor hyperactivity. Herein, we showed that DAT-CI animals present higher striatal dopamine turnover, altered basal phosphorylation state of dopamine and cAMP-regulated phosphoprotein 32 kDa (DARPP32) at Thr75 residue, but preserved D(2) receptor (D(2)R) function. However, although we demonstrated that striatal D(1) receptor (D(1)R) is physiologically responsive under basal conditions, its stimulus-induced activation strikingly resulted in paradoxical electrophysiological, behavioral, and biochemical responses. Indeed, in DAT-CI animals, (1) striatal LTP was completely disrupted, (2) R-(+)-6-chloro-7,8-dihydroxy-1-phenyl-2,3,4,5-tetrahydro-1H-3-benzazepine hydrobromide (SKF 81297) treatment induced paradoxical motor calming effects, and (3) SKF 81297 administration failed to increase cAMP/protein kinase A (PKA)/DARPP32 signaling. Such biochemical alteration selectively affected dopamine D(1)Rs since haloperidol, by blocking the tonic inhibition of D(2)R, unmasked a normal activation of striatal adenosine A(2A) receptor-mediated cAMP/PKA/DARPP32 cascade in mutants. Most importantly, our studies highlighted that amphetamine, nomifensine, and bupropion, through increased striatal dopaminergic transmission, are able to revert motor hyperactivity of DAT-CI animals. Overall, our results suggest that the paradoxical motor calming effect induced by these drugs in DAT-CI mutants depends on selective aberrant phasic activation of D(1)R/cAMP/PKA/DARPP32 signaling in response to increased striatal extracellular dopamine levels.


Figures

Figure 1.
Figure 1.
Spontaneous motor activity and discriminative abilities of DAT-CI mutants. a, b, Horizontal (number of sector crossings) (a) and vertical (counts of seated, wall and free rearing) (b) activity in a novel cage performed by WT and DAT-CI naive mice (n = 16 per genotype). Data are presented as time course with 10 min interval over a 120 min test. c, d, Memory and discriminative abilities of DAT-CI were evaluated in an object recognition test. c, Time of exploration (expressed in seconds) spent by WT (n = 9) and DAT-CI (n = 10) mice contacting the objects to be familiarized, over a 15 min training phase. d, Exploratory preference for the novel object (percentage of total exploration time) spent by WT and DAT-CI mice, over a 5 min test. The dashed line indicates the chance level (50%) of object exploration. All values are expressed as mean ± SEM. **p < 0.01 versus WT mice (one-way ANOVA). Genotypes are as indicated.
Figure 2.
Figure 2.
Paradoxical effect of cocaine, amphetamine, nomifensine, and bupropion on motor activity of DAT-CI mutants. Horizontal motor activity induced in WT and DAT-CI mice by intraperitoneal administration of 40 mg/kg cocaine (WT, n = 8; DAT-CI, n = 7) (a, b), 5 mg/kg amphetamine (n = 8 per genotype) (c, d), 15 mg/kg nomifensine (n = 8 per genotype) (e, f), or 30 mg/kg bupropion (n = 8 per genotype) (g, h), after 1 h of cage habituation. Cocaine, amphetamine, and nomifensine shared the same vehicle group (n = 16 per genotype), whereas bupropion-treated mice were compared with a different vehicle group (WT, n = 4; DAT-CI, n = 8). Locomotion is expressed as number of sector crossings, measured every 10 min over a 1 h test, and presented as time course (a, c, e, g) or total activity (b, d, f, h). All values are expressed as mean ± SEM. **p < 0.01, ***p < 0.0001 versus vehicle group within genotype (one-way ANOVA). Genotypes and treatments are as indicated.
Figure 3.
Figure 3.
Effect of selective NET and SERT inhibitors on DAT-CI motor activity. Horizontal motor activity induced in WT and DAT-CI mice by intraperitoneal injection of 10 mg/kg nisoxetine (WT, n = 7; DAT-CI, n = 11) or vehicle (WT, n = 7; DAT-CI, n = 8) (a, b) or subcutaneous administration of 20 mg/kg fluoxetine (n = 7 per genotype) or vehicle (n = 4 per genotype) (c, d), after 1 h of cage habituation. Locomotion is expressed as number of sector crossings, measured every 10 min over a 1 h test, and presented as time course (a, c) or total activity (b, d). P-Thr202/Tyr204-ERK42/44 protein levels were determined by Western blotting in the striatum of WT (n = 8) and DAT-CI (n = 7) naive mice (e), 20 mg/kg fluoxetine- or vehicle-injected WT (n = 6 per treatment) (f) and DAT-CI (g) mice (20 mg/kg fluoxetine: n = 5; vehicle: n = 6). The top panels show representative blots comparing the different genotypes or treatments, for each protein detected. All data are expressed as mean ± SEM. *p < 0.05 versus vehicle group within genotype (one-way ANOVA). Genotypes and treatments are as indicated.
Figure 4.
Figure 4.
Altered dopaminergic homeostasis in DAT-CI striatum. a, Basal levels of striatal DA, DOPAC, and HVA content, expressed as picomoles per milligram of tissue. b, Dopaminergic catabolism measured as DOPAC/DA ratio. c, Basal levels of striatal NA and 5HT, expressed as picomoles per milligram of tissue. Neurochemical measurements were performed by HPLC in homogenates from WT (n = 8) and DAT-CI (n = 7) naive mice. d, Striatal extracellular DA levels (in nanomolar concentration) after the administration of 100 μm amphetamine (left), 30 μm nomifensine (middle), or 100 μm bupropion (right) in WT and DAT-CI mice (n = 6 per genotype and treatment), measured by voltammetry. *p < 0.05, **p < 0.01, ***p < 0.0001 versus WT (Student's t test). Values are expressed as mean ± SEM. Genotypes and treatments are as indicated.
Figure 5.
Figure 5.
Dopamine D2R-mediated functions in DAT-CI mutants. a, Firing of DA neurons (outward current; in picoamperes) measured by sharp microelectrode recordings in response to bath application of 1 μm quinpirole in WT and DAT-CI mice (n = 9 per genotype). The top panel shows representative trace recordings. b, Horizontal motor activity in WT and DAT-CI mice in response to intraperitoneal administration of 0.5 mg/kg quinpirole (n = 5 per genotype) or vehicle (n = 8 per genotype), in a novel cage. Locomotion is expressed as total number of sector crossings over a 30 min test. c, P-Ser40-TH protein levels determined by Western blotting in the striatum of WT and DAT-CI mice, after intraperitoneal injection of 0.1 mg/kg haloperidol or vehicle (n = 6 per genotype and treatment). The top panels show representative blots comparing the different treatments. d, Horizontal motor activity in WT and DAT-CI mice in response to intraperitoneal administration of 0.1 mg/kg haloperidol (n = 5 per genotype) or vehicle (n = 8 per genotype), over a 60 min test, in a novel cage. All values are expressed as mean ± SEM. a, ***p < 0.0001 versus WT (Student's t test); b–d, *p < 0.05, **p < 0.01, ***p < 0.0001 versus vehicle group within genotype (one-way ANOVA). Genotypes and treatments are as indicated.
Figure 6.
Figure 6.
Dopamine D1R-mediated functions in DAT-CI mutants. Horizontal activity analyzed in WT and DAT-CI mice after intraperitoneal challenge with 0.05 mg/kg SCH 23390 or vehicle (n = 8 per genotype and treatment) (a) and 2.5 mg/kg (WT, n = 6; DAT-CI, n = 7), 5 mg/kg (WT, n = 6; DAT-CI, n = 9) SKF 81297 or vehicle (n = 8 per genotype) (b). Locomotion is expressed as total number of sector crossings, over a 60 min test, performed in a novel home cage for SCH 23390 and after 1 h of cage habituation for SKF 81297. c, Time course (expressed in seconds) of EPSP amplitude, recorded from coronal corticostriatal slices of WT (n = 16) and DAT-CI (n = 12) mice. The arrow shows the time at which HFS protocol (3 trains, 100 Hz, 3 s duration, 20 s interval) was applied. The bottom traces are representative of EPSP amplitudes recorded before and after HFS induction, in WT (left) and DAT-CI mice (right). Calibration: 5 mV, 15 ms. d, Time course (expressed in minutes) of fEPSP slope recorded from parasagittal hippocampal slices of WT and DAT-CI mice (n = 6 per genotype). The arrow shows the time at which HFS protocol (1 train, 100 Hz, 1 s) was applied. Data are expressed as percentage of baseline EPSP slopes measured 60 min after stimulation protocol. The bottom traces are representative of the average fEPSP, recorded 1 min before (pre) and 60 min after (post) the tetanus stimulation, in WT (left) and DAT-CI (right) mice. Calibration: 0.5 mV, 10 ms. All values are expressed as mean ± SEM. a, ***p < 0.0001 versus vehicle group within genotype (one-way ANOVA). b, *p < 0.05, **p < 0.01, ***p < 0.0001 versus vehicle group within genotype (Fisher's post hoc comparison). Genotypes and treatments are as indicated.
Figure 7.
Figure 7.
Aberrant D1R-dependent signaling in the striatum of DAT-CI mutants. Western blotting analysis performed on striatal homogenates in WT and DAT-CI mice, showing basal levels of Golf (n = 32 per genotype) (a) and P-Ser845-GluR1 (WT, n = 8; DAT-CI, n = 7) (b). Western blotting analysis of striatal P-Ser845-GluR1 content in WT and DAT-CI mice, after intraperitoneal challenge with 5 mg/kg SKF 81297 (n = 8 per genotype) or vehicle (n = 8 per genotype) (c); 10 mg/kg amphetamine (n = 15 per genotype) or vehicle (WT, n = 16; DAT-CI, n = 14) (d). The top panels show representative blots comparing the different genotypes (a, b) or treatments (c, d) for each protein detected. All data are expressed as mean ± SEM. **p < 0.01, ***p < 0.0001 versus vehicle group within genotype (one-way ANOVA). Genotypes and treatments are as indicated.
Figure 8.
Figure 8.
Altered DARPP32 phosphorylation in DAT-CI striata. Western blotting analysis performed on striatal homogenates in WT and DAT-CI mice. Basal levels of P-Thr34-DARPP32 (n = 12 per genotype) (a) and P-Thr75-DARPP32 (n = 12 per genotype) (d) are shown. Western blotting analysis of striatal P-Thr34-DARPP32 (b, c) and P-Thr75-DARPP32 (e, f) levels after intraperitoneal challenge with 5 mg/kg SKF 81297 (n = 6 per treatment) or vehicle (n = 6 per treatment), and amphetamine 10 mg/kg (n = 6 per treatment) or vehicle (n = 6 per treatment) in WT (b, e) and DAT-CI (c, f) mice. The top panels indicate representative blots comparing different genotypes (a, d) or treatments (b, c, e, f). All data are expressed as mean ± SEM. b, **p < 0.01 versus vehicle-treated group (Student's t test). d, **p < 0.01 versus WT (Student's t test).
Figure 9.
Figure 9.
Physiological A2AR-dependent response in DAT-CI mice. a, Western blotting analysis of striatal P-Ser845-GluR1 content in WT and DAT-CI mice, after intraperitoneal injection of 0.5 mg/kg haloperidol (WT, n = 8; DAT-CI, n = 7) or vehicle (WT, n = 7; DAT-CI, n = 8). The top panels show representative blots comparing the different treatments. Horizontal activity in WT and DAT-CI mice in response to intraperitoneal injection of 5 mg/kg SCH 58261 (WT, n = 7; DAT-CI, n = 8) or vehicle (WT, n = 7; DAT-CI, n = 8) (b), and 0.25 mg/kg CGS 21680 (WT, n = 8; DAT-CI, n = 7) or vehicle (n = 7 per genotype) (c). Data are presented as total number of sector crossing over 60 min test, performed after 1 h of cage habituation (b), or over 30 min test, performed in a novel cage (c). All data are expressed as mean ± SEM. *p < 0.05, **p < 0.01, ***p < 0.0001 versus vehicle group within genotype (one-way ANOVA). Genotypes and treatments are as indicated.

Similar articles

Cited by

References

    1. Amara SG, Sonders MS. Neurotransmitter transporters as molecular targets for addictive drugs. Drug Alcohol Depend. 1998;51:87–96. - PubMed
    1. Beaulieu JM, Sotnikova TD, Gainetdinov RR, Caron MG. Paradoxical striatal cellular signaling responses to psychostimulants in hyperactive mice. J Biol Chem. 2006;281:32072–32080. - PubMed
    1. Beuming T, Kniazeff J, Bergmann ML, Shi L, Gracia L, Raniszewska K, Newman AH, Javitch JA, Weinstein H, Gether U, Loland CJ. The binding sites for cocaine and dopamine in the dopamine transporter overlap. Nat Neurosci. 2008;11:780–789. - PMC - PubMed
    1. Bevins RA, Besheer J. Object recognition in rats and mice: a one-trial non-matching-to-sample learning task to study “recognition memory.”. Nat Protoc. 2006;1:1306–1311. - PubMed
    1. Bibb JA, Snyder GL, Nishi A, Yan Z, Meijer L, Fienberg AA, Tsai LH, Kwon YT, Girault JA, Czernik AJ, Huganir RL, Hemmings HC, Jr, Nairn AC, Greengard P. Phosphorylation of DARPP-32 by Cdk5 modulates dopamine signalling in neurons. Nature. 1999;402:669–671. - PubMed

MeSH terms