. 2010 Aug 18;30(33):11128-42.
doi: 10.1523/JNEUROSCI.1327-10.2010.

Intrinsic circuit organization and theta-gamma oscillation dynamics in the entorhinal cortex of the rat

Affiliations

Intrinsic circuit organization and theta-gamma oscillation dynamics in the entorhinal cortex of the rat

Pascale Quilichini et al. J Neurosci. .

Abstract

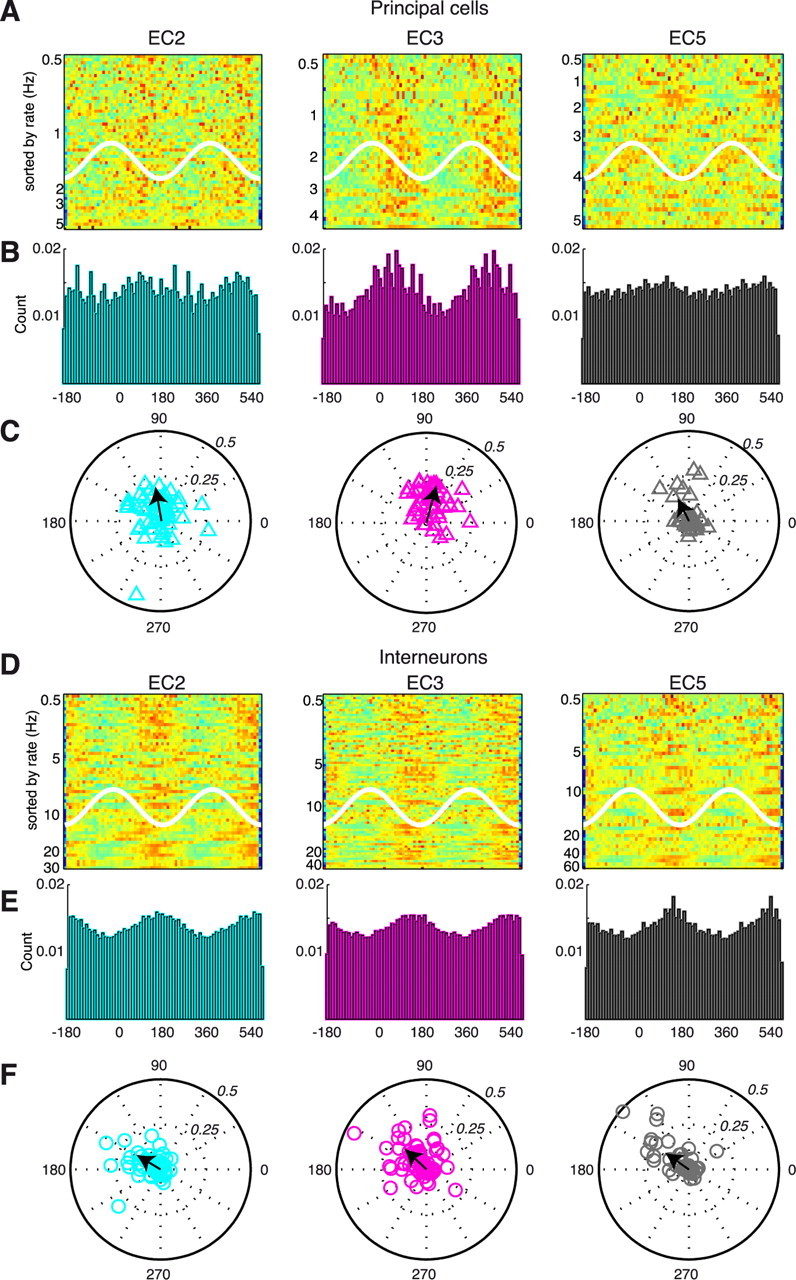
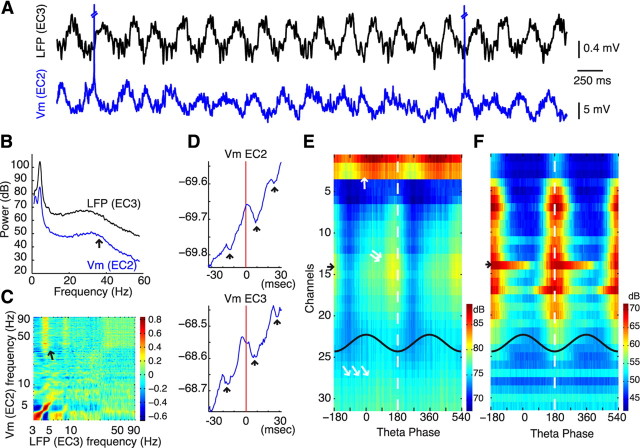
A thorough knowledge of the intrinsic circuit properties of the entorhinal cortex (EC) and the temporal dynamics these circuits support is essential for understanding how information is exchanged between the hippocampus and neocortex. Using intracellular and extracellular recordings in the anesthetized rat and anatomical reconstruction of single cells, we found that EC5 and EC2 principal neurons form large axonal networks mainly within their layers, interconnected by the more vertically organized axon trees of EC3 pyramidal cells. Principal cells showed layer-specific unique membrane properties and contributed differentially to theta and gamma oscillations. EC2 principal cells were most strongly phase modulated by EC theta. The multiple gamma oscillators, present in the various EC layers, were temporally coordinated by the phase of theta waves. Putative interneurons in all EC layers fired relatively synchronously within the theta cycle, coinciding with the maximum power of gamma oscillation. The special wiring architecture and unique membrane properties of EC neurons may underlie their behaviorally distinct firing patterns in the waking animal.


Figures

Figure 1.
Figure 1.
Anatomical properties of EC principal neurons. Three-dimensional reconstruction of the dendrites (yellow) and axon arbor (red) of in vivo filled EC2 stellate neuron and EC3 and EC5 pyramidal cells. Each reconstruction was drawn from successive sagittal sections, the outlines of which are indicated by gray lines (top row). Bottom row, Superimposed (n = 56, 23, and 51 for EC2, EC3, and EC5 neurons, respectively) sections to illustrate the layer distribution of dendrites and axons. WM, White matter. Note that most axon collaterals of the EC2 stellate neuron are confined to EC1, the axon tree of the EC5 cell occupies mostly EC5 and EC3, whereas the relatively sparse axon collaterals of the EC3 neuron span nearly equally all layers.
Figure 2.
Figure 2.
Dendritic and axonal details of example EC2, EC3, and EC5 neurons. Morphological details of in vivo biocytin-filled EC2 stellate neuron (A), EC3 (B), and EC5 (C) pyramidal cells on a Nissl-stained background. The black arrow points to the emergence of the axon. Boutons are indicated by red arrows. The apical and basal dendrites are also magnified. Red boxes enclose spines.
Figure 3.
Figure 3.
Biophysical properties of EC principal neurons in vivo. Input resistance (A; IR), mean Vm (B), and Ih (C) of EC2 principal cells. The inset in C shows example responses to hyperpolarizing current steps (−0.2 nA, 500 ms), showing a sag (inward rectifying current) in the EC2 cell. D, Excitability, defined as the number of spikes to depolarizing neurons (0.5 nA, 500 ms pulses); E, spontaneous firing rate of the neurons. F, Lack of a relationship between excitability and spontaneous firing rate. Note the smallest variability of EC2 neurons in all measures. Layer- and region-specific color coding applies to all figures.
Figure 4.
Figure 4.
Network patterns in the EC. A, Schemata of the intracellular and extracellular (silicon probe; oblique) recordings from the dorsomedial entorhinal cortex (d-MEC). The different regions of the hippocampus, dentate gyrus (DG), subicular complex (Sub, PrS, PaS), and lateral EC (L Ent) are also indicated. alv, Alveus. B, DiI (red)-labeled silicon probe track on a Nissl counterstained section. The 32 recording sites of the probe are also indicated. C, Biocytin-filled EC2 stellate cell from a single Nissl counterstained section. D, Spectrogram of LFP from the EC3 layer of the entorhinal cortex. Arrow, Administration of an additional dose of ketamine/xylazine. Note the sharp 4-Hz-band and gamma-band (>30 Hz) oscillations during theta activity and dominant ∼1 Hz band during slow oscillations. E, F, Simultaneously recorded example LFP and intracellular traces during theta (E) and slow (F) oscillations. Black, Original traces; red, spike-clipped, smoothed traces. G, H, Distribution of membrane potential fluctuations during theta and slow oscillations. EC2 cells did not show prominent bimodal up and down states (see also Fig. 1B) (Isomura et al., 2006).
Figure 5.
Figure 5.
Contribution of EC neurons to LFP theta. A, Relationship between LFP (in EC3, top row) and membrane potential (Vm) in example EC2, EC3, and EC5 neurons (middle row) during theta oscillations. Bottom row, Coherence between LFP and Vm. B, Power and coherence spectra for the respective neurons. C, Theta power of the membrane potential (Vm) fluctuation, normalized by the theta power of the LFP (**p < 0.002). D, Relationship between LFP and Vm theta power. E, Relationship between LFP theta power and mean “resting” Vm. F, Distribution of within-session coherence, measured in 3 s segments (1 s overlap, **p < 0.005). The mean group coherence values are shown by the box plots. G–I, Theta coherence as a function of intracellular theta power (G), LFP theta power (H), and theta frequency (I).
Figure 6.
Figure 6.
Theta oscillations in intracellularly identified EC neurons. A, Polar plots of preferred phase and modulation depth (mean resultant length; line) of EC2, EC3, and EC5 neuron intracellular (IC) spikes referenced to theta oscillation in EC3 (filled symbols). Phase difference and coherence between the membrane potential (Vm; open symbols) and LFP (peak of theta = 0, 360°; trough = 180°) is shown for all neurons. B, Population discharge probability of intracellularly identified principal neurons from different subregions as a function of EC3 theta phase (gray trace). Two theta cycles are shown to facilitate visual comparison. Bin size, 10°. Note strongest theta modulation in EC2 neurons.
Figure 7.
Figure 7.
Depth profiles of EC LFP patterns. A, Short epoch (2 s) of LFP (1 Hz to 5 kHz) recorded by a 32-site, single-shank silicon probe. B, Averaged theta waves (black traces) and CSD map. Putative active sinks (S1, S2, S3) are marked. C, Averaged gamma waves (black traces) and CSD map. Note phase reversal of both theta and gamma waves at the border of EC1 and EC2. D, Color-coded depth profile maps of power (whitened spectra; see Materials and Methods), coherence (relative to EC3 LFP; arrow), and phase of LFP (note log frequency scale). Theta (2–5 Hz), gamma (30–60 Hz), and high-frequency (200–600 Hz) bands are marked by blue, green, and red dashed lines, respectively. Right, Power, coherence, and depth profiles of the three marked frequency bands.
Figure 8.
Figure 8.
Physiological identification of putative EC principal cells and interneurons. A, Autocorrelograms and average filtered (0.8–5kHz) waveforms of a putative EC2 principal cell (yellow) and an EC2 interneuron (purple). Abscissa indicates milliseconds. Right, Cross-correlogram revealed short-latency monosynaptic excitation between neuron 1 and neuron 2 (dashed lines indicate 1 and 99% global confidence intervals estimated by spike jittering on a uniform interval of [−5, 5] ms) (Fujisawa et al., 2008). B, Same display as in A but for an EC3 interneuron–principal cell pair. Note short-latency suppression of spikes in the target principal neuron. C, Monosynaptic inhibitory connection between a putative EC3 interneuron and intracellularly recorded and histologically verified EC3 pyramidal cell. Top, Autocorrelogram of the inhibitory interneuron. Bottom, Cross-correlogram between the spikes of the reference interneuron and pyramidal cell. The spike-triggered average of Vm of the pyramidal cell (black line; n = 94,221 events) is superimposed on the cross-correlogram. Note short-latency hyperpolarization on the rising phase of the intracellular theta oscillation. D, Physiologically identified principal cells (yellow triangles; n = 196) and interneurons (purple circles; n = 260) as a function of waveform asymmetry, trough-to-peak latency (width; see inset; 0.8–5 kHz) (Sirota et al., 2008; Mizuseki et al., 2009), and firing rate (see Materials and Methods). Note that single-cell features alone do not provide perfect separation of principal cells and interneurons. E, Putative subnetworks of the physiologically identified neurons in a single experiment. Triangle, Principal cell; oval, interneuron; arrow, putative excitatory connection; square, inhibitory connection. The autocorrelogram of each neuron is shown within symbols. Note cross-layer pairs between putative principal cells and interneurons in EC2 and EC3. Note also putative excitatory connections between EC2 principal cells (1 and 2, for instance). Cross-correlogram identifies the presynaptic cell as excitatory (1 and 2). The monosynaptically driven postsynaptic neuron of the pair is also excitatory as shown by its cross-correlation with another neurons (putative interneuron 3). F, Network effects induced by a single neuron. Discharge of an EC2 or EC3 principal cell evoked long-latency, presumably multisynaptically mediated, firing patterns in target neurons.
Figure 9.
Figure 9.
Theta phase modulation of EC neurons. A, Color-coded discharge probability of physiologically identified, extracellularly recorded EC2 (n = 54), EC3 (n = 43), and EC5 (n = 40) principal cells as a function of EC3 theta phase (white line). Each row is a single neuron, normalized to its peak firing rate (red = 1). Neurons are sorted according to firing rate (left axis). Only neurons with at least 50 spikes, firing rate >0.5 Hz, and significant theta modulation (Rayleigh test, p < 0.01) are included. B, Population discharge probability of the EC principal neuron groups shown in A. All neurons are included. Bin size, 10°. C, Polar plots of preferred phase and theta modulation depth of single neurons (symbols) and group mean (black arrows). D–F, Same display as A–C for physiologically identified EC2 (n = 56), EC3 (n = 73), and EC5 (n = 49) interneurons. Note strongest theta phase modulation in EC2 principal neurons. Note also that EC2 and EC3 principal cells tend to fire at the opposite phase of the theta oscillations (Mizuseki et al., 2009).
Figure 10.
Figure 10.
Gamma phase modulation of EC neurons. A, Color-coded discharge probability of physiologically identified, extracellularly recorded EC2, EC3, and EC5 (n = 40) principal cells as a function of local gamma phase (white line). Each row is a single neuron, normalized to its peak firing rate (red = 1). Neurons are sorted according to firing rate (left axis). B, Population discharge probability of the EC principal neuron groups shown in A. All neurons are included, independent of whether their spikes were significantly modulated by gamma phase or not. Bin size, 10°. C, Polar plots of preferred phase and gamma modulation depth of single neurons (symbols) and group mean (black arrows). Only neurons with at least 50 spikes and firing rate >0.5 Hz (Rayleigh test, p < 0.01) are included. D–F, Same display as A–C for physiologically identified EC2 (n = 56), EC3 (n = 73), and EC5 (n = 49) interneurons. Note phase-delayed firing of interneurons relative to principal cells in all layers.
Figure 11.
Figure 11.
Theta phase modulation of gamma power. A, Short epoch (5 s) of LFP in EC3 (1 Hz to 1.25 kHz) and Vm of an EC2 stellate cell with the strongest theta modulation. Note theta and faster gamma waves in Vm. Spikes are clipped. B, Power spectra of LFP and Vm. Arrow, Intracellular gamma band activity. C, Power–power correlation (comodugram) between LFP and Vm. Note strong power–power coupling at theta frequency (4.5 Hz) and LFP theta modulation of EC2 Vm gamma power (arrow; note log scale). D, Average Vm in EC2 and EC3 neurons triggered by spikes of physiologically identified interneurons. Zero milliseconds is the time of the reference interneuron spike (each trace is an average of 1419 and 2702 events). Arrows indicate IPSPs at gamma frequency superimposed on the larger-amplitude theta-related Vm. E, Theta phase modulation of integrated LFP gamma power (30–90 Hz; color coded) as a function of recording depth (recording sites 1–32 of the silicon probe). Horizontal arrow, Theta phase reference site (recording site 14 in EC3; black trace). Single, double, and triple arrows, Peaks of EC1/EC2, EC3, and EC5 gamma power, respectively. F, Theta phase modulation of high-frequency (>200 Hz) power. Note the phase-locking of power to the trough of EC3 theta and high-frequency power in EC2–EC3.

Similar articles

Cited by

References

    1. Alonso A, García-Austt E. Neuronal sources of theta rhythm in the entorhinal cortex of the rat. I. Laminar distribution of theta field potentials. Exp Brain Res. 1987a;67:493–501. - PubMed
    1. Alonso A, García-Austt E. Neuronal sources of theta rhythm in the entorhinal cortex of the rat. II. Phase relations between unit discharges and theta field potentials. Exp Brain Res. 1987b;67:502–509. - PubMed
    1. Alonso A, Klink R. Differential electroresponsiveness of stellate and pyramidal-like cells of medial entorhinal cortex layer II. J Neurophysiol. 1993;70:128–143. - PubMed
    1. Alonso A, Llinás RR. Subthreshold Na+-dependent theta-like rhythmicity in stellate cells of entorhinal cortex layer II. Nature. 1989;342:175–177. - PubMed
    1. Amaral DG, Witter MP. The three-dimensional organization of the hippocampal formation: a review of anatomical data. Neuroscience. 1989;31:571–591. - PubMed

Publication types

MeSH terms

LinkOut - more resources