. 2010 Aug 18;30(33):11188-96.
doi: 10.1523/JNEUROSCI.1046-10.2010.

Repeated stress impairs endocannabinoid signaling in the paraventricular nucleus of the hypothalamus

Affiliations

Repeated stress impairs endocannabinoid signaling in the paraventricular nucleus of the hypothalamus

Jaclyn I Wamsteeker et al. J Neurosci. .

Abstract

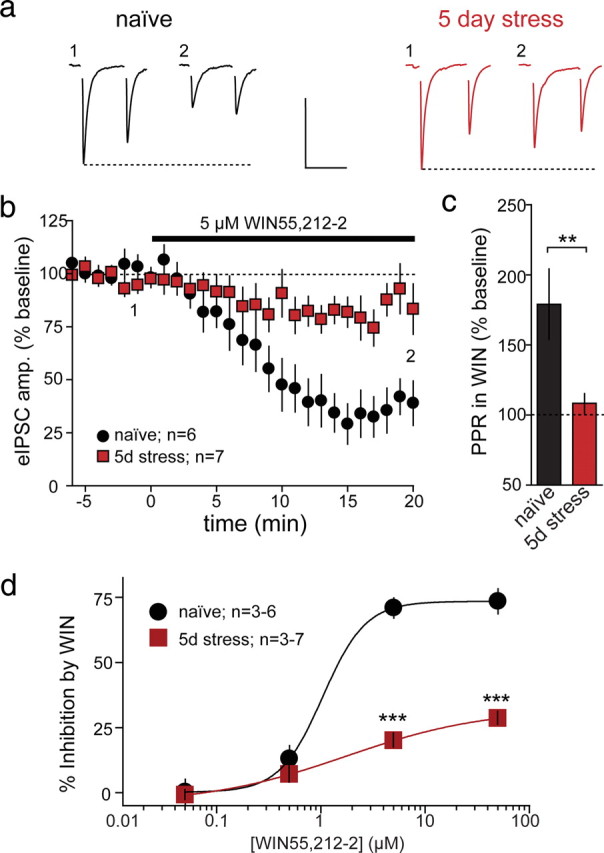
Endocannabinoids (eCBs) are ubiquitous retrograde signaling molecules in the nervous system that are recruited in response to robust neuronal activity or the activation of postsynaptic G-protein-coupled receptors. Physiologically, eCBs have been implicated as important mediators of the stress axis and they may contribute to the rapid feedback inhibition of the hypothalamic-pituitary-adrenal axis (HPA) by circulating corticosteroids (CORTs). Understanding the relationship between stress and eCBs, however, is complicated by observations that eCB signaling is itself sensitive to stress. The mechanisms that link stress to changes in synaptic eCB signaling and the impact of these changes on CORT-mediated negative feedback have not been resolved. Here, we show that repetitive immobilization stress, in juvenile male rats, causes a functional downregulation of CB(1) receptors in the paraventricular nucleus of the hypothalamus (PVN). This loss of CB(1) receptor signaling, which requires the activation of genomic glucocorticoid receptors, impairs both activity and receptor-dependent eCB signaling at GABA and glutamate synapses on parvocellular neuroendocrine cells in PVN. Our results provide a plausible mechanism for how stress can lead to alterations in CORT-mediated negative feedback and may contribute to the development of plasticity of HPA responses.


Figures

Figure 1.
Figure 1.
PNCs in the PVN exhibit activity-dependent eCB signaling at GABA synapses. a, Schematic of coronal section showing PVN with location of PNCs shown in expanded section. Whole-cell voltage-clamp recordings were made from PNCs. Adapted from Paxinos and Watson (2005). b, Representative recording illustrates time course and magnitude of DSI in response to a voltage step to +20 mV for 5 s. Traces show eIPSC responses (1) during baseline recording, (2) immediately after postsynaptic depolarization, and (3) after 2 min when eIPSC amplitude had recovered. Calibration: 200 pA, 20 ms. c, Summary of DSI in all cells tested (n = 18). d, Postsynaptic depolarization transiently depresses frequency but not amplitude of spontaneous IPSCs (n = 18). e, Summary graph showing that maximal DSI is significantly inhibited by the CB1 receptor antagonist AM251 (5 μm bath application), inclusion of BAPTA (10 mm) in the intracellular pipette solution, or the L-type calcium channel antagonist nifedipine (10 μm bath application). N for each group is inset within bars (overall ANOVA, p = 0.001, F = 7.29). Post hoc versus naive p values are shown as *p < 0.05 and **p < 0.01. Error bars indicate SEM.
Figure 2.
Figure 2.
Loss of activity-dependent eCB signaling after repeated immobilization stress. a, Sample data from a single cell showing no DSI after postsynaptic depolarization in a 5 d stress animal. Calibration: 200 pA, 20 ms. b, Average of DSI experiments in animals subjected to 30 min of immobilization stress repeated once daily for 5 d (n = 10). c, Summary bar graph of maximal DSI in naive animals and animals subjected to 1, 3, 5, or 10 d of immobilization stress. N for each group is inset within bars (overall ANOVA, p = 0.0003, F = 6.47). Post hoc comparisons are shown as *p < 0.05 and **p < 0.01. Error bars indicate SEM.
Figure 3.
Figure 3.
Time course of recovery of eCB signaling after 5 d immobilization stress. a, Sample data from an individual cell in an animal subjected to 5 d immobilization stress and then allowed to recover for 3 d shows significant recovery of DSI. Calibration: 100 pA, 20 ms. b, Average of DSI data from animals subjected to 5 d stress followed by 3 d recovery (gray), with 5 d stress (red) data replotted for comparison. c, Bar graph of maximal DSI from animals allowed to recover from 5 d stress for 1 or 3 d compared with 5 d stress data to show that DSI is fully recovered by 3 d after stress. N for each group is inset within bars (overall ANOVA, p = 0.02, F = 4.22). Post hoc comparisons are shown as *p < 0.05. Error bars indicate SEM.
Figure 4.
Figure 4.
Loss of eCB signaling requires CORT activation of genomic GC receptors. a, Sample cell from a slice incubated in CORT (100 nm) for 1 h shows robust DSI. Calibration: 200 pA, 20 ms. b, Average of DSI data from slices incubated for 1 h in CORT (n = 7) with naive data replotted for comparison. c, Summary graph comparing maximal DSI from naive slices with those incubated in CORT for 1 and 3 h (overall ANOVA, p = 0.049, F = 3.34). d, Representative data from one cell from an animal injected with RU-486 (25 mg/kg body weight, i.p.) 10 min before each episode of immobilization stress for 5 d (blue). Calibration: 150 pA, 20 ms. e, Averaged data from n = 8 cells demonstrate that DSI is present in animals administered RU-486 before 5 d stress. f, Summary graph comparing maximal DSI of 5 d stress to 5 d stress with DMSO vehicle or the GC receptor antagonist RU-486 injected before stress (overall ANOVA, p = 0.006, F = 4.90). N for each group is inset within bars. Post hoc comparisons are shown as *p < 0.05. Error bars indicate SEM.
Figure 5.
Figure 5.
Presynaptic CB1 receptor function is compromised after 5 d immobilization stress. a, Sample data showing paired-pulse eIPSC recordings during (1) baseline and (2) 20 min after application of the CB1 receptor agonist WIN55,212-2 (WIN) (5 μm) in cells from a naive animal (black) and an animal subjected to 5 d of immobilization stress (red). Calibration: 150 pA, 50 ms. b, Averaged data showing the efficacy of WIN in suppressing eIPSC amplitude in cells from naive (n = 6) versus 5 d stress (n = 7) animals. c, Summary graph comparing WIN-mediated change in PPR after 20 min between treatment groups. **p < 0.01, t test. d, Dose–response of WIN inhibition of eIPSC amplitude in naive and stressed animals. Post hoc comparisons are shown as ***p < 0.001 (two-way ANOVA). Error bars indicate SEM.
Figure 6.
Figure 6.
DSI in hippocampal CA1 pyramidal neurons is unaffected by 5 d immobilization stress. a, Representative eIPSCs from single hippocampal CA1 pyramidal neurons (1) during baseline, (2) immediately after depolarization, and (3) 1 min after depolarization recorded in naive (black) and 5 d stressed (red) animals. Calibration: 300 pA, 50 ms. b, Averaged data from naive (n = 11) and 5 d stress (n = 10) animals showing that depolarization to +20 mV for 5 s similarly elicits a robust depression of eIPSC amplitude between treatment groups. c, Summary graph shows that maximal DSI in CA1 neurons is not significantly different in naive versus 5 d stressed animals. N for each group is inset within bars (p > 0.05, t test). Error bars indicate SEM.
Figure 7.
Figure 7.
PNCs exhibit activity-dependent eCB signaling at glutamate synapses. a, Representative single eEPSC recording illustrates the time course of DSE. Traces show eEPSC responses in (1) baseline and at (2) 0 min and (3) 2 min after depolarization to +20 mV for 5 s. Calibration: 100 pA, 10 ms. b, Averaged data from n = 20 cells show the time course of DSE. c, Postsynaptic depolarization transiently depresses frequency but not amplitude of spontaneous EPSCs (n = 20). d, Summary graph of maximal DSE showing that DSE in naive slices is significantly reduced in the presence of CB1 receptor antagonist AM251 (5 μm bath), inclusion of BAPTA (10 mm intrapipette), or the L-type calcium channel antagonist nifedipine (10 μm bath) (overall ANOVA, p = 0.0006, F = 7.24). N for each group is inset within bars. Post hoc versus naive p values are shown as *p < 0.05 and **p < 0.01. Error bars indicate SEM.
Figure 8.
Figure 8.
Genomic GC receptor activation during repeated immobilization stress compromises CB1 receptor function at glutamate synapses. a, Sample data from a single cell in a 5 d stress animal showing eEPSC amplitude (1) before, (2) immediately after, and (3) 1 min after a depolarizing step. Calibration: 100 pA, 10 ms. b, Averaged data from DSE experiments in 5 d immobilization stressed animals (red). c, Summary graph of maximal DSE in naive animals and animals subjected to 1, 3, or 5 d of immobilization stress (overall ANOVA, p = 0.003, F = 5.51). d, Representative paired-pulse eEPSC recordings (1) during baseline recording and (2) 20 min after continuous bath administration of WIN (5 μm) in a naive animal (black) and an animal subjected to 5 d of immobilization stress (red) and average data illustrating the effect of WIN in naive (n = 6) and 5 d stress animals (n = 6). Calibration: 100 pA, 50 ms. e, Representative traces from one cell in an animal injected with RU-486 (25 mg/kg body weight, i.p.) 10 min before each episode of immobilization stress for 5 d and averaged data from RU-486-treated animals (n = 8; blue). Calibration: 100 pA, 10 ms. f, Summary graph of maximal DSE comparing 5 d stress to 5 d stress with either DMSO vehicle or the GC receptor antagonist RU-486 injected 10 min before each immobilization episode (overall ANOVA, p = 0.0004, F = 7.21). N for each group is inset within bars. Post hoc comparisons are shown as *p < 0.05 and ***p < 0.001. Error bars indicate SEM.
Figure 9.
Figure 9.
Loss of GPCR-dependent production of eCBs after repeated immobilization stress. a, Suppression of quantal glutamate release in response to a DEX-responsive putative GPCR is reduced by 5 d stress. Representative recordings of mEPSCs (recorded in 1 μm tetrodotoxin) from naive (black) and 5 d stress (red) animals before (baseline) and after (10 min) bath perfusion of 5 μm water-soluble DEX. Calibration: 50 pA, 1 s. b, Averaged data of normalized mEPSC frequency from naive (n = 8) and 5 d stress (n = 8) animals showing loss of DEX effects on mEPSC frequency. c, Summary graph of mEPSC frequency (as percentage of baseline) after 10 min of DEX in naive and 5 d stress animals, and in naive slices bathed in AM251 (5 μm) (overall ANOVA, p = 0.0009, F = 11.34). N for each group is inset within bars. Post hoc comparisons are shown as **p < 0.01 and ***p < 0.001. Error bars indicate SEM.

References

    1. Avital A, Richter-Levin G. Exposure to juvenile stress exacerbates the behavioural consequences of exposure to stress in the adult rat. Int J Neuropsychopharmacol. 2005;8:163–173. - PubMed
    1. Breivogel CS, Childers SR, Deadwyler SA, Hampson RE, Vogt LJ, Sim-Selley LJ. Chronic delta9-tetrahydrocannabinol treatment produces a time-dependent loss of cannabinoid receptors and cannabinoid receptor-activated G proteins in rat brain. J Neurochem. 1999;73:2447–2459. - PubMed
    1. Cole MA, Kalman BA, Pace TW, Topczewski F, Lowrey MJ, Spencer RL. Selective blockade of the mineralocorticoid receptor impairs hypothalamic-pituitary-adrenal axis expression of habituation. J Neuroendocrinol. 2000;12:1034–1042. - PubMed
    1. Dallman MF. Fast glucocorticoid actions on brain: back to the future. Front Neuroendocrinol. 2005;26:103–108. - PubMed
    1. David DJ, Samuels BA, Rainer Q, Wang JW, Marsteller D, Mendez I, Drew M, Craig DA, Guiard BP, Guilloux JP, Artymyshyn RP, Gardier AM, Gerald C, Antonijevic IA, Leonardo ED, Hen R. Neurogenesis-dependent and -independent effects of fluoxetine in an animal model of anxiety/depression. Neuron. 2009;62:479–493. - PMC - PubMed

Publication types

MeSH terms

Substances