

A temporal hierarchy for conspecific vocalization discrimination in humans
- PMID: 20720129
- PMCID: PMC6633490
- DOI: 10.1523/JNEUROSCI.2239-10.2010
A temporal hierarchy for conspecific vocalization discrimination in humans
Abstract
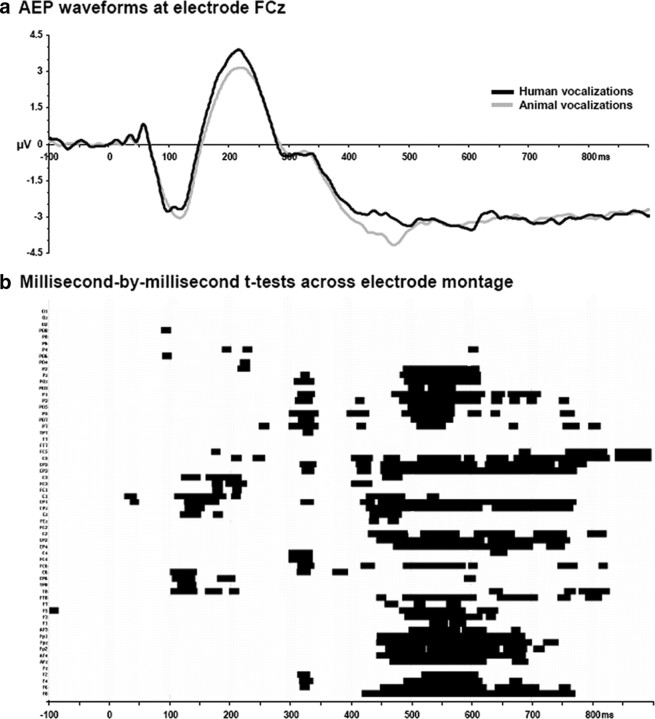
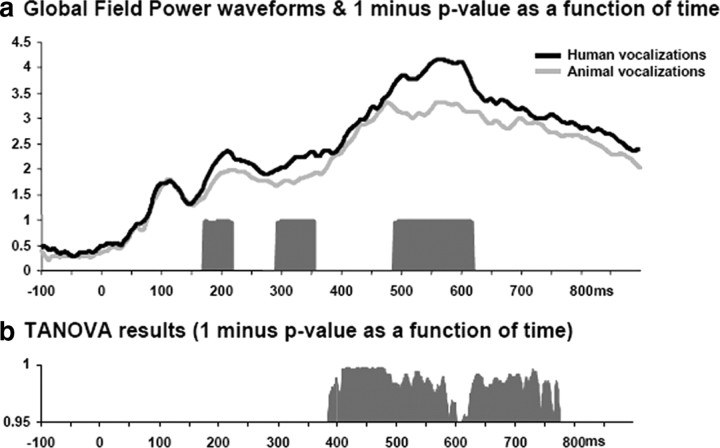
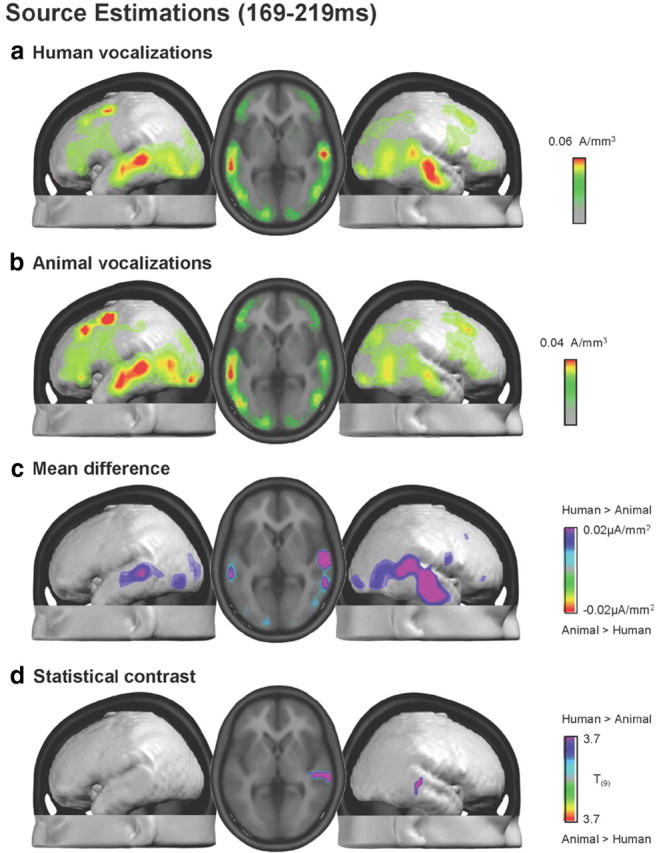
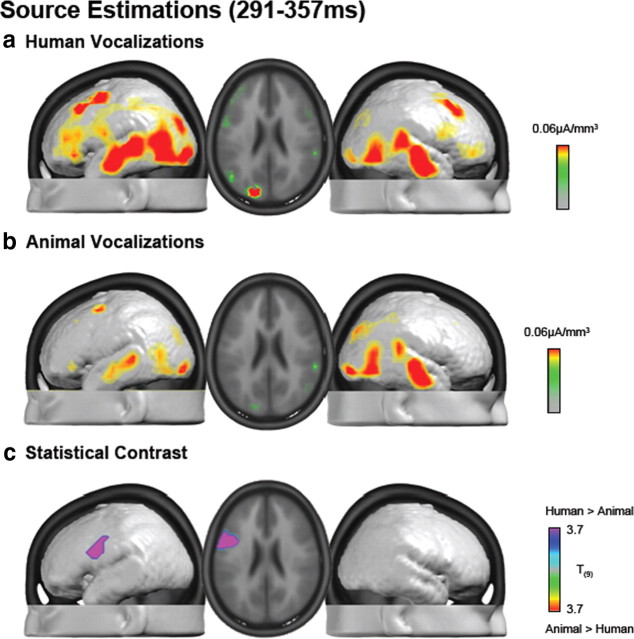
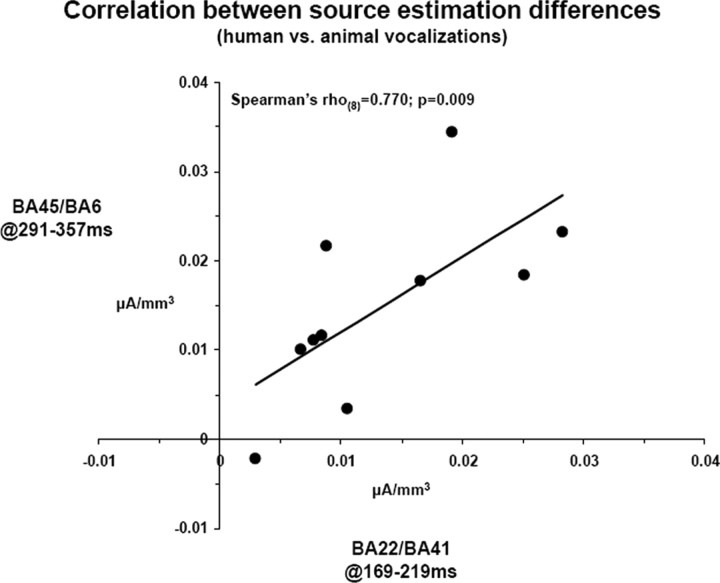
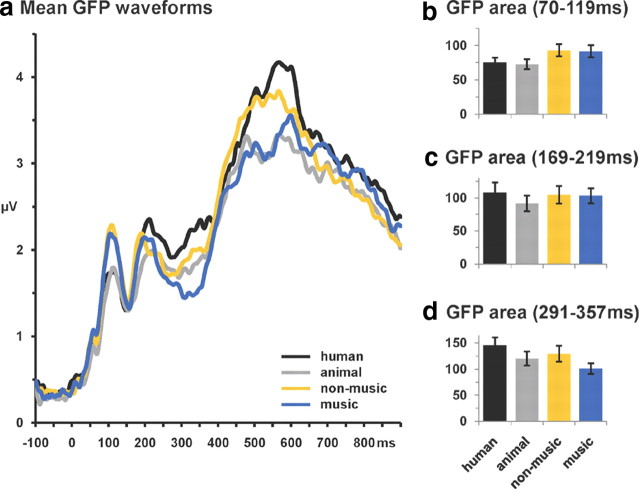
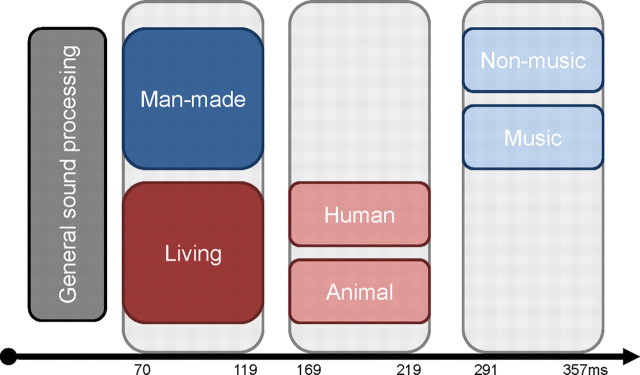
The ability to discriminate conspecific vocalizations is observed across species and early during development. However, its neurophysiologic mechanism remains controversial, particularly regarding whether it involves specialized processes with dedicated neural machinery. We identified spatiotemporal brain mechanisms for conspecific vocalization discrimination in humans by applying electrical neuroimaging analyses to auditory evoked potentials (AEPs) in response to acoustically and psychophysically controlled nonverbal human and animal vocalizations as well as sounds of man-made objects. AEP strength modulations in the absence of topographic modulations are suggestive of statistically indistinguishable brain networks. First, responses were significantly stronger, but topographically indistinguishable to human versus animal vocalizations starting at 169-219 ms after stimulus onset and within regions of the right superior temporal sulcus and superior temporal gyrus. This effect correlated with another AEP strength modulation occurring at 291-357 ms that was localized within the left inferior prefrontal and precentral gyri. Temporally segregated and spatially distributed stages of vocalization discrimination are thus functionally coupled and demonstrate how conventional views of functional specialization must incorporate network dynamics. Second, vocalization discrimination is not subject to facilitated processing in time, but instead lags more general categorization by approximately 100 ms, indicative of hierarchical processing during object discrimination. Third, although differences between human and animal vocalizations persisted when analyses were performed at a single-object level or extended to include additional (man-made) sound categories, at no latency were responses to human vocalizations stronger than those to all other categories. Vocalization discrimination transpires at times synchronous with that of face discrimination but is not functionally specialized.
Figures

Similar articles
-
Rapid brain discrimination of sounds of objects.J Neurosci. 2006 Jan 25;26(4):1293-302. doi: 10.1523/JNEUROSCI.4511-05.2006. J Neurosci. 2006. PMID: 16436617 Free PMC article.
-
From bird to sparrow: Learning-induced modulations in fine-grained semantic discrimination.Neuroimage. 2015 Sep;118:163-73. doi: 10.1016/j.neuroimage.2015.05.091. Epub 2015 Jun 9. Neuroimage. 2015. PMID: 26070264
-
Human cortical organization for processing vocalizations indicates representation of harmonic structure as a signal attribute.J Neurosci. 2009 Feb 18;29(7):2283-96. doi: 10.1523/JNEUROSCI.4145-08.2009. J Neurosci. 2009. PMID: 19228981 Free PMC article.
-
How do auditory cortex neurons represent communication sounds?Hear Res. 2013 Nov;305:102-12. doi: 10.1016/j.heares.2013.03.011. Epub 2013 Apr 17. Hear Res. 2013. PMID: 23603138 Review.
-
Processing of communication sounds: contributions of learning, memory, and experience.Hear Res. 2013 Nov;305:31-44. doi: 10.1016/j.heares.2013.06.005. Epub 2013 Jun 18. Hear Res. 2013. PMID: 23792078 Free PMC article. Review.
Cited by
-
The processing of intimately familiar and unfamiliar voices: Specific neural responses of speaker recognition and identification.PLoS One. 2021 Apr 16;16(4):e0250214. doi: 10.1371/journal.pone.0250214. eCollection 2021. PLoS One. 2021. PMID: 33861789 Free PMC article.
-
Event-related potentials indicate differential neural reactivity to species and valence information in vocal stimuli in sleeping dogs.Sci Rep. 2023 Sep 4;13(1):14518. doi: 10.1038/s41598-023-40851-w. Sci Rep. 2023. PMID: 37666838 Free PMC article.
-
Levels of neuroticism can predict attentional performance during cross-modal nonspatial repetition inhibition.Atten Percept Psychophys. 2022 Nov;84(8):2552-2561. doi: 10.3758/s13414-022-02583-3. Epub 2022 Oct 17. Atten Percept Psychophys. 2022. PMID: 36253587
-
Early Left Parietal Activity Elicited by Direct Gaze: A High-Density EEG Study.PLoS One. 2016 Nov 23;11(11):e0166430. doi: 10.1371/journal.pone.0166430. eCollection 2016. PLoS One. 2016. PMID: 27880776 Free PMC article.
-
Abnormal Habituation of the Auditory Event-Related Potential P2 Component in Patients With Schizophrenia.Front Psychiatry. 2021 Mar 18;12:630406. doi: 10.3389/fpsyt.2021.630406. eCollection 2021. Front Psychiatry. 2021. PMID: 33815168 Free PMC article.
References
-
- Aeschlimann M, Knebel JF, Murray MM, Clarke S. Emotional pre-eminence of human vocalizations. Brain Topogr. 2008;20:239–248. - PubMed
-
- Assal G, Aubert C, Buttet J. Asymétrie cérébrale et reconnaissance de la voix. Revue Neurolog. 1981;137:255–268. - PubMed
-
- Belin P, Zatorre RJ, Lafaille P, Ahad P, Pike B. Voice-selective areas in human auditory cortex. Nature. 2000;403:309–312. - PubMed
-
- Belin P, Zatorre RJ, Ahad P. Human temporal-lobe response to vocal sounds. Brain Res Cogn Brain Res. 2002;13:17–26. - PubMed
-
- Belin P, Fecteau S, Bédard C. Thinking the voice: neural correlates of voice perception. Trends Cogn Sci. 2004;8:129–135. - PubMed
Publication types
MeSH terms
LinkOut - more resources
Full Text Sources