. 2010 Dec;24(12):4889-903.
doi: 10.1096/fj.10-162107. Epub 2010 Aug 18.

Functional role of gangliotetraosylceramide in epithelial-to-mesenchymal transition process induced by hypoxia and by TGF-{beta}

Affiliations

Functional role of gangliotetraosylceramide in epithelial-to-mesenchymal transition process induced by hypoxia and by TGF-{beta}

Feng Guan et al. FASEB J. 2010 Dec.

Abstract

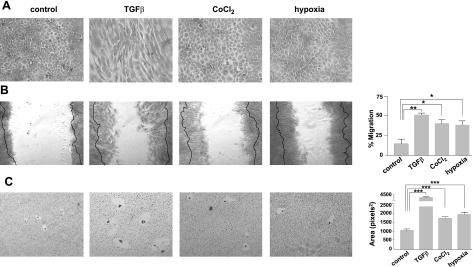
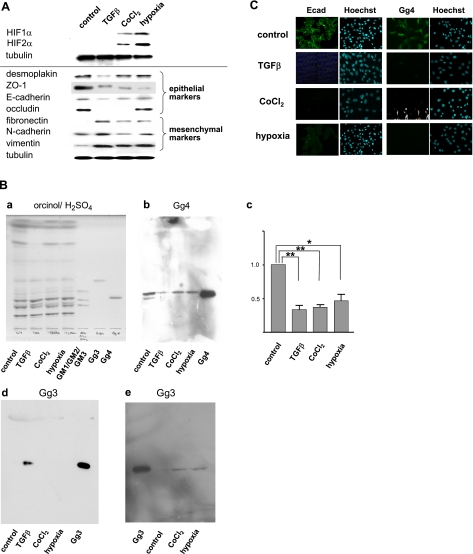
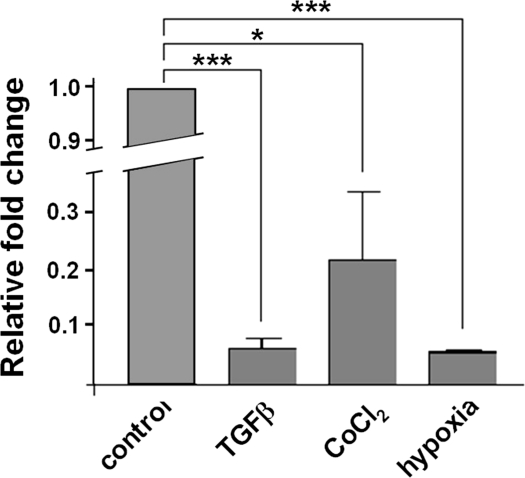
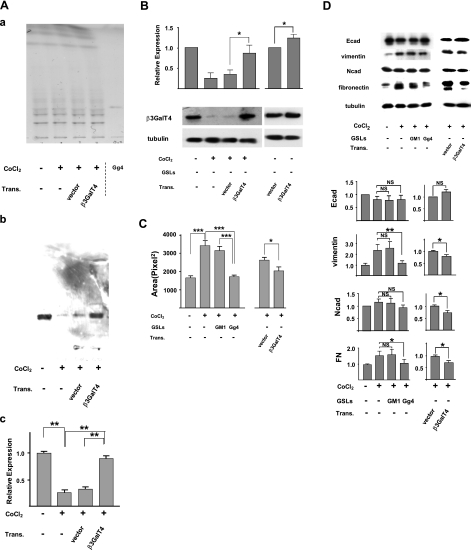
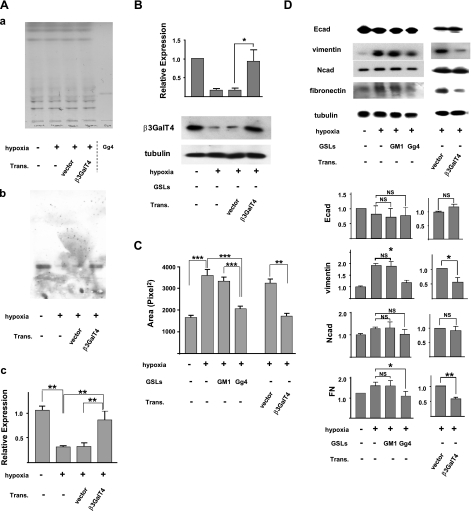
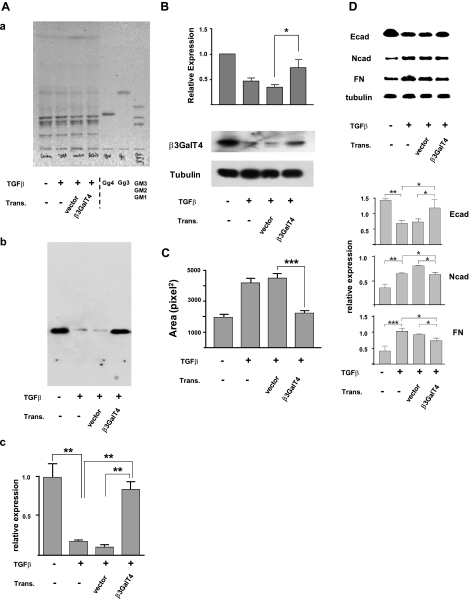
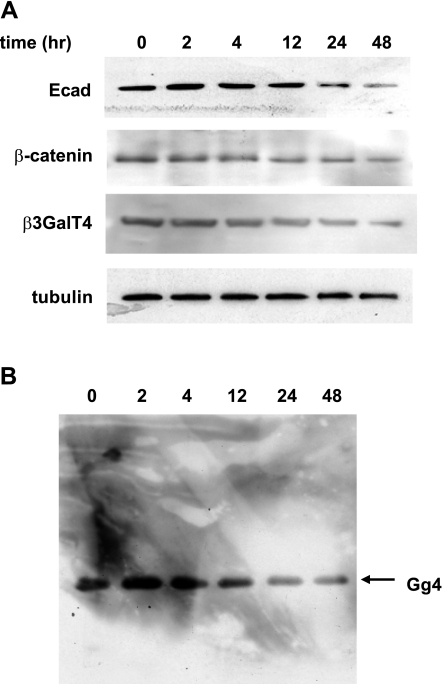
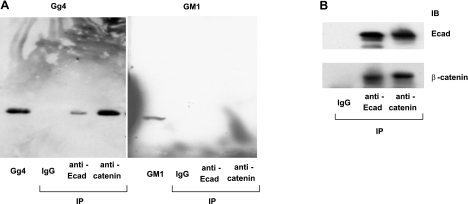
The epithelial-to-mesenchymal transition (EMT) is a basic cellular process that plays a key role in normal embryonic development and in cancer progression/metastasis. Our previous study indicated that EMT processes of mouse and human epithelial cells induced by TGF-β display clear reduction of gangliotetraosylceramide (Gg4) and ganglioside GM2, suggesting a close association of glycosphingolipids (GSLs) with EMT. In the present study, using normal murine mammary gland (NMuMG) cells, we found that levels of Gg4 and of mRNA for the UDP-Gal:β1-3galactosyltransferase-4 (β3GalT4) gene, responsible for reduction of Gg4, were reduced in EMT induced by hypoxia (∼1% O(2)) or CoCl(2) (hypoxia mimic), similarly to that for TGF-β-induced EMT. An increase in the Gg4 level by its exogenous addition or by transfection of the β3GalT4 gene inhibited the hypoxia-induced or TGF-β-induced EMT process, including changes in epithelial cell morphology, enhanced motility, and associated changes in epithelial vs. mesenchymal molecules. We also found that Gg4 is closely associated with E-cadherin and β-catenin. These results suggest that the β3GalT4 gene, responsible for Gg4 expression, is down-regulated in EMT; and Gg4 has a regulatory function in the EMT process in NMuMG cells, possibly through interaction with epithelial molecules important to maintain epithelial cell membrane organization.


Figures

Figure 1.
Figure 1.
Ganglioside expression in control and TGF-β-treated NMuMG cells. A) Semiconfluent NMuMG cells in a culture dish (150 mm; Corning, Corning, NY, USA) were treated, and GSLs were extracted and analyzed as described in Materials and Methods. An appropriate aliquot, based on the same amount of protein from the cell suspension, was spotted on an HPTLC plate together with standard GM1, GM2, GM3, Gg4, Gg3, GD1a, and FucGM1. After developing with chloroform/methanol/aqueous 0.2% CaCl2 (60:35:8), GSLs were visualized by spraying with orcinol/sulfuric acid (a) or immunostained with mAb TKH7 for Gg4 (b) or GD1a-1 for GD1a (d) and TKH5 for FucGM1 (e) or by affinity blot with CTB for GM1 (c), as described in Materials and Methods. Triplicate experiments gave similar results. B) Relative expression of Gg4, GM1, and GD1a in TGF-β-treated cells and control cells was calculated based on density analysis of HPTLC staining. Change in expression of each ganglioside is presented as mean ± sd percentage of the control value. *P < 0.05; NS, not significant.
Figure 2.
Figure 2.
Effect of TGF-β, CoCl2, and hypoxia treatment on cell morphology and cell motility. A) For the cell morphology study, NMuMG cells were grown and treated as described in Materials and Methods, fixed with 2% paraformaldehyde/PBS, stained with 1% toluidine blue, and photographed by phase-contrast microscopy. B) Cell motility was assessed by wound assay. Image panels: cell monolayers treated with TGF-β, CoCl2, and hypoxia were scratched with a 1- to 10-μl pipette tip at the marked position. Cells were washed with fresh serum-free medium twice and cultured in fresh culture medium. Pictures of the wounds were taken at 0 h and after an 8-h incubation under the normoxia condition at the marked position by Nikon phase-contrast microscopy (×80). Bold lines on each photo show the original edge of the scratched area at 0 h. Right panel: results are expressed as mean ± sd percentage area covered by moving cells after 8 h, analyzed using the Scion Image program. All experiments were performed in triplicate. *P < 0.05; **P < 0.01. C) Cell motility was assessed by a phagokinetic cell motility assay. Image panels: NMuMG cells cultured and treated as above were detached with trypsin/EDTA, and 5 × 10³ cells in complete culture medium were added onto each gold sol-coated well and incubated for 8 h under normoxia. Photos of track areas of 30 cells were taken; representative photos are presented. Right panel: cleared areas on gold sol were measured, analyzed using the Scion Image program as squared pixels, and are shown as means ± sd. Two independent experiments gave similar results. ***P < 0.001.
Figure 3.
Figure 3.
Effect of TGF-β, CoCl2, and hypoxia on expression of epithelial vs. mesenchymal cell molecules, and expression of gangliosides. A) Cells were harvested, lysed in RIPA buffer, and subjected (10 μg protein/lane) to SDS-PAGE. For analysis of HIFs, which were not clearly detectable using RIPA lysates, cells were lysed with SDS-PAGE loading buffer. After the transferring and blocking procedure, membranes were incubated with primary antibodies and incubated with appropriate secondary antibody conjugated with HRP, and proteins were revealed with a SuperSignal chemiluminescence substrate kit (Thermo-Fisher/Pierce, Rockford, IL, USA). After stripping with ReBlot Plus Mild Solution (Chemicon/Millipore, Temecula, CA, USA), each membrane was reblotted with γ-tubulin as a loading control. Experiments were performed in triplicate, and representative Western blot results are shown. B) GSLs were extracted and analyzed by HPTLC as described in Materials and Methods. a) Orcinol/sulfuric acid spray. b) Gg4 detected with TKH7. c) Relative expression of Gg4 in control, TGF-β-, CoCl2-, or hypoxia-treated cells; presented as mean ± sd percentage of control value, as described for Fig. 1B. **P < 0.01; *P < 0.05; NS, not significant. d, e) Gg3 detected with 2D4. Notably, amounts of GSL spotted in e are 10 times higher than those in a, b, d. C) NMuMG cells (2×10⁴) were seeded onto 12-mm-diameter glass cover slips in 24-well tissue culture plates; treated with TGF-β, CoCl2, or hypoxia as described in Materials and Methods; fixed with 2% fresh paraformaldehyde/PBS; blocked with 1% BSA/0.1% NaN3/PBS; and stained with anti-Ecad (left) or anti-Gg4 TKH7 (right), as described in Materials and Methods. Clear nuclei staining with Hoechst 44442 is shown next to each antibody staining.
Figure 4.
Figure 4.
Expression of the β3GalT4 gene in TGF-β-, CoCl2-, and hypoxia-treated cells. RNAs were prepared from control, TGFβ-, CoCl2-, or hypoxia-treated cells, as described in Materials and Methods. cDNA was prepared using SuperScript III First-Strand Super Mix and digested with DNase, and quantitative real-time PCR was performed as described in Materials and Methods. Data were analyzed using the 2−ΔΔCt method as described previously (44) and represent fold change in gene expression relative to the nontreated control. *P < 0.05; **P < 0.01.
Figure 5.
Figure 5.
Inhibition of CoCl2-induced EMT by overexpressed β3GalT4 or exogenous Gg4. To study the effect of ganglioside GM1 or Gg4 on the CoCl2-induced EMT process, cells were preincubated with 50 μM GM1 or Gg4 for 24 h and then were cultured in medium with 100 μM CoCl2 in the continued presence of 50 μM Gg4 or GM2 for 24 h. For study of the effect of overexpressed β3GalT4 on the CoCl2-induced EMT process, cells were treated with CoCl2 for 24 h and then were transfected with mouse β3GalT4 gene/pIRES-puro3 or vector only, as described in Materials and Methods. These cells were used for analysis of Gg4 and β3GalT4 expression, EMT marker molecules, and cell motility. Trans., transfection. A) For Gg4 analysis, cells (4×10⁵/dish in a 6-cm dish) were treated with CoCl2 and transfected. GSLs were extracted and analyzed by HPTLC: a) orcinol/sulfuric acid spray; b) stained with TKH7 for Gg4. Experiments were performed in triplicate; representative HPTLC-immunostaining results are shown. c) Gg4 expression detected with TKH7 was calculated based on density analysis from 3 experiments; relative expression is shown as percentage of the control value. **P < 0.01. B) For β3GalT4 expression analysis, cells (5×10⁴/well in a 12-well plate) were treated and transfected as described above. Cells were harvested, lysed in RIPA buffer, and subjected (10 μg of protein/slot) to SDS-PAGE. β3GalT4 expression in transfected cells was determined by Western blot as described in Materials and Methods. Experiments were performed in triplicate; representative Western blot results are shown (bottom). Normalized values with each loading control are shown as mean ± sd relative intensity on the ordinate (top). C) For the phagokinetic cell motility assay, NMuMG cells (5×10⁴ cells/well in a 12-well plate) were treated as described above. Cells were detached with trypsin/EDTA, and 5 × 10³ cells in complete culture medium were added onto each gold sol-coated well and incubated for 8 h, as described in Materials and Methods. Photos of track areas of 30 cells were taken. Cleared areas on gold sol were measured; values are means ± sd (squared pixels) from the Scion Image program. *P < 0.05; ***P < 0.001. D) For EMT marker protein analysis, cells were treated, and SDS-PAGE and Western blot were performed as described above. Experiments were performed in triplicate, and representative Western blot results are shown (top). Normalized values with each loading control are shown as mean ± sd relative intensity on the ordinate (bottom). *P = 0.01–0.05; **P = 0.001–0.005; NS, not significant.
Figure 6.
Figure 6.
Inhibition of hypoxia-induced EMT by overexpressed β3GalT4 or exogenous Gg4. Cells were grown and treated with the hypoxia condition as described in Materials and Methods. GM1 or Gg4 was added, and transfection procedures were performed as described for Fig. 5. Expression of Gg4 (A) and β3GalT4 (B) in transfected cells, cell motility (C), and expression of EMT marker protein (D) affected by overexpressed β3GalT4 or exogenous Gg4 are shown as described for Fig. 5. Trans., transfection. *P = 0.01–0.05; **P = 0.001–0.005; ***P < 0.001; NS, not significant.
Figure 7.
Figure 7.
Inhibition of TGF-β-induced EMT by overexpressed β3GalT4. Cells were cultured in culture medium overnight; then medium was replaced with fresh medium alone (control) or with fresh medium containing 1 ng/ml TGF-β for 18 h. Transfection was performed as described in Materials and Methods and for Fig. 5. Cells were analyzed for Gg4 expression (A), β3GalT4 expression (B), cell motility (C), and EMT marker molecules (D), as described for Fig. 5. Trans., transfection. A) For Gg4 analysis, cells (4×10⁵/dish in a 6-cm dish) were treated with TGF-β and transfected. GSLs were extracted, and analyzed by HPTLC: a) orcinol/sulfuric acid spray; b) stained with TKH7 for Gg4. Experiments were performed in triplicate, and representative HPTLC immunostaining results are shown. c) Gg4 expression detected with TKH7 was calculated based on density analysis from 3 experiments and is shown as relative expression, as described for Fig. 5. **P < 0.01. B) For β3GalT4 expression analysis, cells (5×10⁴/well in a 12-well plate) were treated and transfected as described above. Cells were harvested, lysed in RIPA buffer, and subjected (10 μg of protein/slot) to SDS-PAGE. β3GalT4 expression in transfected cells was determined by Western blot as described in Materials and Methods. Experiments were performed in triplicate; representative Western blot results are shown (bottom). Normalized values with each loading control are shown as mean ± sd relative intensity on the ordinate (top). *P = 0.01–0.05. C) NMuMG cells were treated as described above. Phagokinetic cell motility assay was performed as described for Fig. 5. Values are means ± sd (squared pixels) from Scion Image. ***P < 0.001. D) For EMT marker protein analysis, cells were treated as described above. Experiments were performed in triplicate. Representative Western blot results are shown (top); normalized values with each loading control are shown as mean ± sd relative intensity on the ordinate (bottom). *P = 0.01–0.05; **P = 0.001–0.005; ***P < 0.001; NS, not significant.
Figure 8.
Figure 8.
Expression of Ecad, β-catenin, β3GalT4, and Gg4 at various times after TGF-β treatment. Cells were treated with 2 ng/ml TGF-β for various periods of time as indicated. A) Cells were harvested, and cell lysates prepared using RIPA buffer were subjected to Western blot analysis with antibodies against Ecad, β-catenin, β3GalT4, or γ-tubulin. B) Cells treated as above were harvested and extracted with isopropanol/hexane/water (55:25:20) for Gg4 detection with mAb TKH7. as described in Materials and Methods.
Figure 9.
Figure 9.
Interaction of Gg4 with the Ecad/β-catenin complex. PNF prepared from NMuMG cells was precleared with protein A/G agarose beads and incubated with protein A/G agarose beads prebound with control mouse IgG, anti-Ecad, or anti-β-catenin antibody at 4°C for 3 h, as described in Materials and Methods, and subjected to HPTLC and Western blot analysis as described below. A) For HPTLC analysis, the mixture was washed 5 times with washing buffer (100 mM sodium phosphate and 150 mM sodium chloride, pH 7.2), and GSLs were extracted with isopropanol/hexane/water (55:25:20). After hydrolysis of glycerophospholipids in 0.1 M NaOH in methanol at 40°C for 2 h and neutralization with 1 N HCl, extracts were evaporated, desalted with a Sep-Pak C18 cartridge, and dried under a nitrogen stream. The GSL preparation was dissolved in chloroform/methanol (2:1). An amount equivalent to 500 μg of protein of starting PNF, together with standard Gg4 or GM1 as control, was applied to HPTLC and detected with mAb TKH7 (left) or CTB (right). B) For Western blot analysis, the mixture was washed 5 times with washing buffer and boiled for 10 min in SDS-PAGE sample buffer, and an amount equivalent to 10 μg of starting PNF was subjected to SDS-PAGE. After the transferring and blocking procedure, membranes were incubated with anti-Ecad or anti-β-catenin antibodies and incubated with goat anti-mouse IgG HRP conjugate, and proteins were revealed with a SuperSignal chemiluminescence substrate kit. IP, immunoprecipitation; IB, immunoblotting.

Similar articles

Cited by

References

    1. Hay E. D. (2005) The mesenchymal cell, its role in the embryo, and the remarkable signaling mechanisms that create it. Dev. Dyn. 233, 706–720 - PubMed
    1. Sugrue S. P., Hay E. D. (1981) Response of basal epithelial cell surface and cytoskeleton to solubilized extracellular matrix molecules. J. Cell Biol. 91, 45–54 - PMC - PubMed
    1. Sugrue S. P., Hay E. D. (1982) Interaction of embryonic corneal epithelium with exogenous collagen, laminin, and fibronectin: role of endogenous protein synthesis. Dev. Biol. 92, 97–106 - PubMed
    1. Sugrue S. P., Hay E. D. (1986) The identification of extracellular matrix (ECM) binding sites on the basal surface of embryonic corneal epithelium and the effect of ECM binding on epithelial collagen production. J. Cell Biol. 102, 1907–1916 - PMC - PubMed
    1. Lee J. M., Dedhar S., Kalluri R., Thompson E. W. (2006) The epithelial-mesenchymal transition: new insights in signaling, development, and disease. J. Cell Biol. 172, 973–981 - PMC - PubMed

Publication types

MeSH terms

LinkOut - more resources