. 2011 Jan 5;52(1):101-8.
doi: 10.1167/iovs.10-5799.

The transition zone between healthy and diseased retina in patients with retinitis pigmentosa

Affiliations

The transition zone between healthy and diseased retina in patients with retinitis pigmentosa

Donald C Hood et al. Invest Ophthalmol Vis Sci. .

Abstract

Purpose: To describe the structural changes in the transition zone from relatively healthy retinal regions to severely affected regions in patients with retinitis pigmentosa (RP) using frequency domain optical coherence tomography (fdOCT).

Methods: FdOCT line scans of the horizontal meridian were obtained from one eye of 13 patients with RP and 30 control subjects. The patients had normal or near normal foveal sensitivities and visual field diameters ≥10°. Using a computer-aided manual segmentation procedure, the locations at which the outer segment (OS) and outer nuclear layer plus outer plexiform layer (ONL+) thicknesses fell below the 95% confidence interval of the controls were measured, as were the locations at which the OS layer disappeared and the locations at which the ONL+ was reduced to an asymptotically small thickness.

Results: The progression from healthy to severely affected regions followed a common pattern in most patients. Region A, the central region including the foveal center, had normal OS and ONL+ thickness. Region B had abnormal OS but normal ONL+ thickness. Region C had abnormal but measurable OS and ONL+ thicknesses. In Region D, the OS layer disappeared, as did the IS/OS line, and the ONL+ thickness decreased further. In Region E, the ONL+ reached an asymptotic thickness.

Conclusions: The structural changes in the transition zone followed an orderly progression from a thinning of the OS layer, to a thinning of the ONL+, to a loss of the OS layer, to an ONL+ reduced to an asymptotically small level.


Figures

Figure 1.
Figure 1.
(A) A fdOCT 8.6 mm scan of the horizontal meridian of a normal retina. (B) Same scan as in (A), but with the borders segmented shown as the colored lines.
Figure 2.
Figure 2.
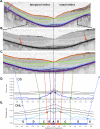
(A) fdOCT scan of the horizontal meridian of a patient with RP. Colored lines indicate the borders segmented. (B) Magnified version of the central portion of the scan in (A). Red arrows indicate the point at with the OLM is no longer apparent. (C) Same as in (B) but with segmented lines. (D) OS thickness profiles across retina for the scan in (A) (blue) and for the mean (bold black) and ±2 SD (thin black) of scans from 30 healthy controls. The filled purple symbols mark the points at which the OS thickness falls below the 95% CI (black lines), and the green symbols mark the points at which the OS thickness approaches zero. (E) ONL+ thickness profiles across retina for the scan in (A) (light blue) and for the mean (bold black) and ±2 SD (thin black) of scans from 30 healthy controls. The filled red symbols mark the points at which the ONL+ thickness falls below the 95% CI (black lines), and the blue symbols mark the points at which the ONL+ thickness approaches an asymptotic level.
Figure 3.
Figure 3.
(A) Symbols are the patients' OS layer thickness in the nasal retina normalized by dividing by the mean thickness for the 30 controls over the same portion of the retina. (B) Same as in (A), but for the temporal retina. (C) Same as in (A), but for the ONL+ thickness. (D) Same as in (B), but for the ONL+ thickness.
Figure 4.
Figure 4.
(A) Symbols are the patients' OS layer thickness in the nasal retina expressed as z-scores. The difference between a patient's OS thickness and the mean thickness for the 30 controls, over the same portion of the retina, was divided by the SD of the 30 control values. (B) Same as in (A), but for the temporal retina. (C) Same as in (A), but for the ONL+ thickness. (D) Same as in (B), but for the ONL+ thickness.
Figure 5.
Figure 5.
Same as in Figure 4 but for INL (A, B), RGC+IPL layer (C, D), and RNFL (E).
Figure 6.
Figure 6.
(A) A peripheral portion of the scan in Figure 1B. (B) A similar portion of the retina for the scan in Figure 2A. (C) Same scan as in (B), but magnified and without the borders. The green arrow shows the end of a discernable INL/OPL border.

Similar articles

Cited by

References

    1. Jacobson SG, Aleman TS, Sumaroka A, et al. Disease boundaries in the retina of patients with Usher syndrome caused by MYO7A gene mutations. Invest Ophthalmol Vis Sci. 2009;50:1886–1894 - PubMed
    1. Aleman TS, Cideciyan AV, Sumaroka A, et al. Retinal laminar architecture in human retinitis pigmentosa caused by rhodopsin gene mutations. Invest Ophthalmol Vis Sci. 2008;49:1580–1590 - PMC - PubMed
    1. Aleman TS, Cideciyan AV, Sumaroka A, et al. Inner retinal abnormalities in X-linked retinitis pigmentosa with RPGR mutations. Invest Ophthalmol Vis Sci. 2007;48:4759–4765 - PMC - PubMed
    1. Hood DC, Lin CE, Lazow MA, et al. Thickness of receptor and post-receptor retinal layers in patients with retinitis pigmentosa measured with frequency-domain optical coherence tomography. Invest Ophthalmol Vis Sci. 2009;50:2328–2336 - PMC - PubMed
    1. Rangaswamy NV, Patel HM, Locke KG, et al. A comparison of visual field sensitivity to photoreceptor thickness in retinitis pigmentosa. Invest Ophthalmol Vis Sci. 2010;51:4213–4219 - PMC - PubMed

Publication types

MeSH terms