. 2011 Mar;17(3):720-31.
doi: 10.1002/ibd.21419. Epub 2010 Aug 18.

Tumor necrosis factor-α represses the expression of NHE2 through NF-κB activation in intestinal epithelial cell model, C2BBe1

Affiliations

Tumor necrosis factor-α represses the expression of NHE2 through NF-κB activation in intestinal epithelial cell model, C2BBe1

Md Ruhul Amin et al. Inflamm Bowel Dis. 2011 Mar.

Abstract

Background: High levels of proinflammatory cytokines are linked to pathogenesis of diarrhea in inflammatory bowel disease (IBD). Na(+) absorption is compromised in IBD. The studies were designed to determine the effect of tumor necrosis factor-α (TNF-α) on the expression and activity of NHE2, a Na(+) /H(+) exchanger (NHE) that is involved in transepithelial Na(+) absorption in intestinal epithelial cells.

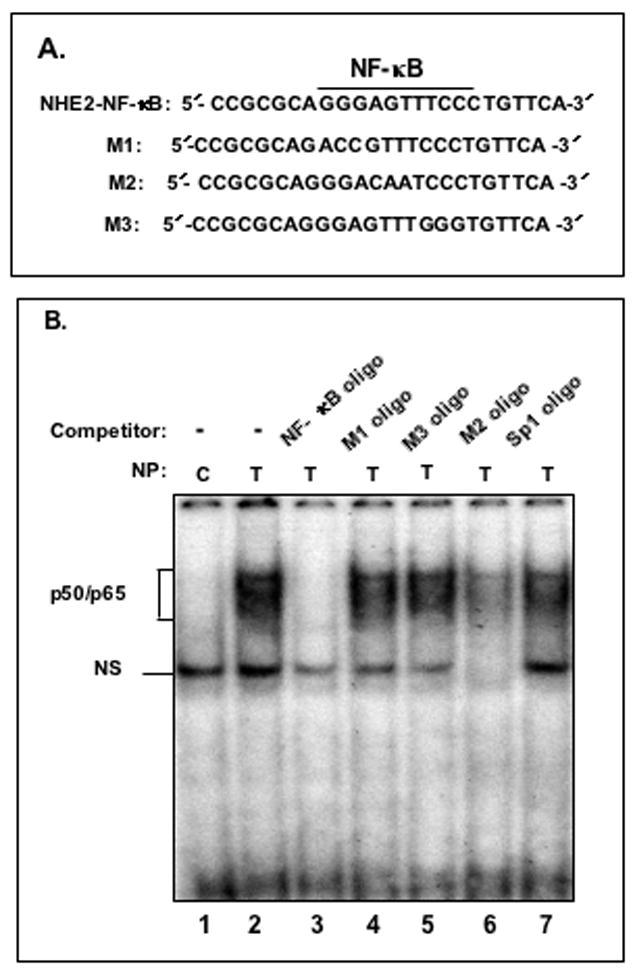
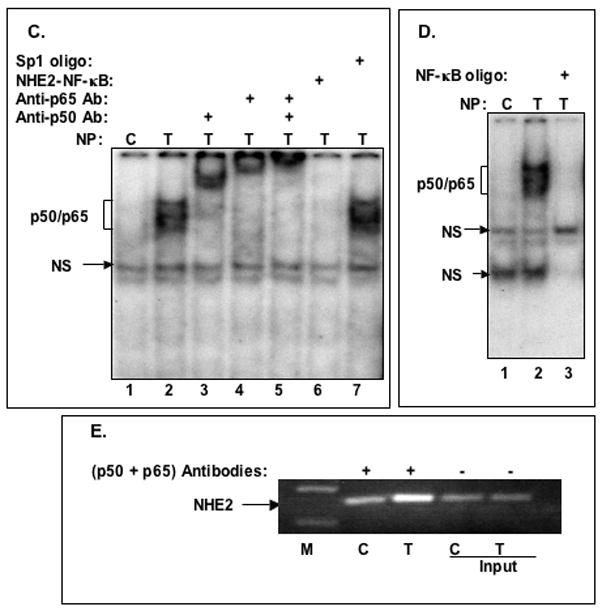
Methods: NHE2 regulation was examined in TNF-α-treated C2BBe1 cells by reverse-transcription polymerase chain reaction (RT-PCR), reporter gene assays, and Western blot analysis. NHE isoform activities were measured as ethyl-isopropyl-amiloride- and HOE694-sensitive (22) Na-uptake. In vitro and in vivo protein-DNA interactions were assessed by gel mobility shift assays and chromatin immunoprecipitation studies.

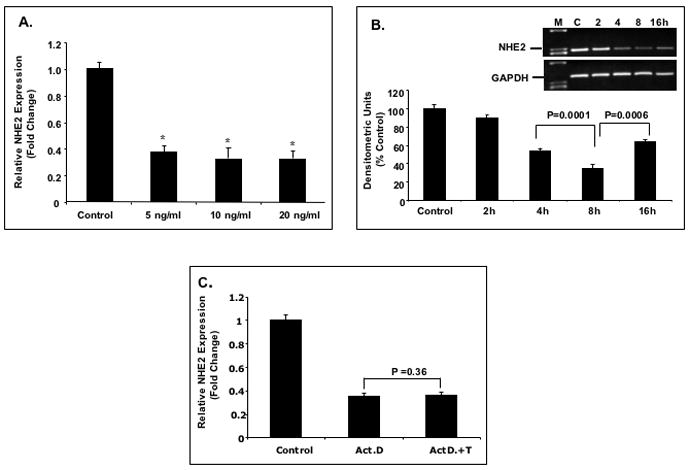
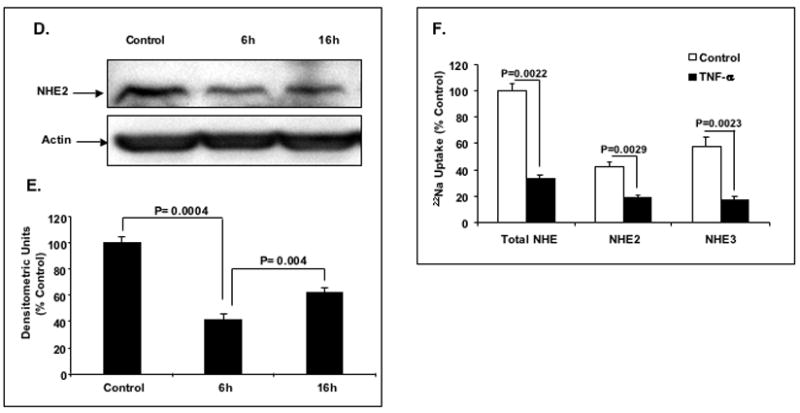
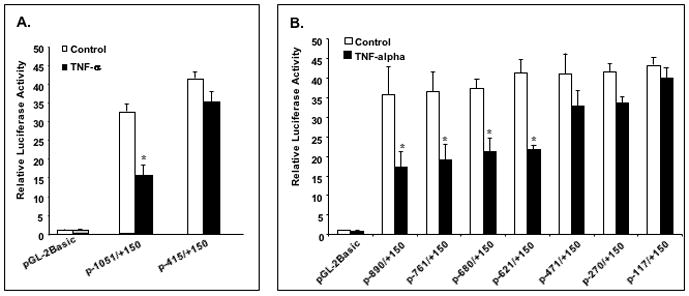
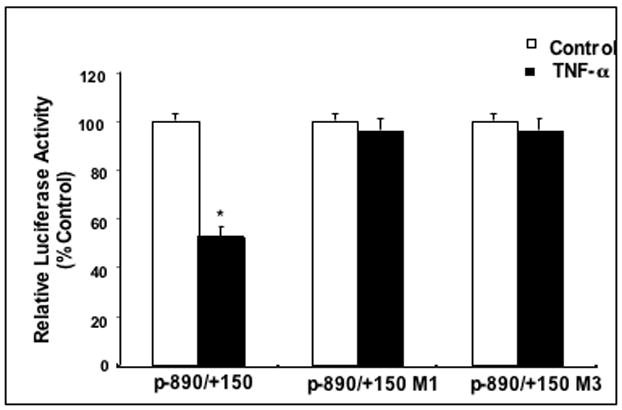
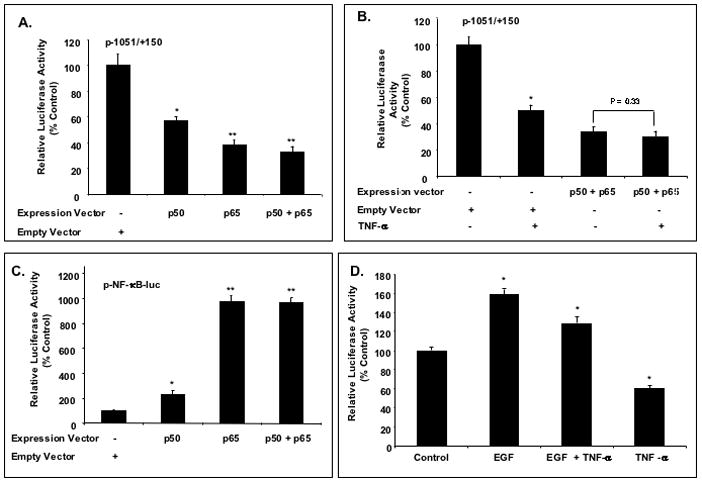
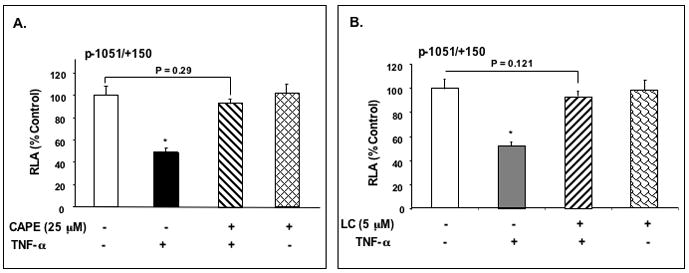
Results: TNF-α treatment of C2BBe1 cells led to repression of NHE2 promoter activity, mRNA, and protein levels; and inhibited both NHE2 and NHE3 mediated (22) Na-uptake. 5'-deletion analysis of the NHE2 promoter-reporter constructs identified basepair -621 to -471 as the TNF-α-responsive region (TNF-RE). TNF-α activated NF-κB subunits, p50 and p65, and their DNA-binding to a putative NF-κB motif within TNF-RE. Mutations in the NF-κB motif abolished NF-κB-DNA interactions and abrogated TNF-α-induced repression. Ectopic overexpression of NF-κB resulted in repression of NHE2 expression. Two functionally distinct inhibitors of NF-κB blocked the inhibitory effect of TNF-α.

Conclusions: The human NHE2 isoform is a direct target of transcription factor NF-κB. TNF-α-mediated activation of NF-κB decreases the expression and activity of NHE2 in the intestinal epithelial cell line, C2BBe1. These findings implicate NF-κB in the modulation of Na(+) absorption during intestinal inflammatory conditions such as IBD where a high level of TNF-α is detected.


Figures

Figure 1
Figure 1. Effect of TNF-α on the expression and transport activity of NHE2 in C2BBe1 cells
A: Quantitative real-time RT-PCR. Cells were serum-starved in DMEM containing 0.5% FBS for 24 h and treated with different concentrations of TNF-α for 6 h and total RNA was extracted. 5 μg of RNA from each treatment was reverse transcribed to cDNA and equal amounts of cDNA from each sample were subjected to amplification by real-time PCR. The data were normalized to GAPDH as control and changes in NHE2 expression was calculated. The NHE2 mRNA level in untreated cells was considered 100%. Values are means ± SE of three separate experiments performed in triplicates. * P< 0.05 compare to control. B: Time-course of TNF-α effect on the expression of the NHE2 mRNA. C2BBe1 cells were treated with TNF-α (10 ng/ml) for 0, 2, 4, 8, and 16 h and total RNA was extracted subjected to semi-quantitative PCR. The effects of TNF-α on the NHE2 mRNA levels at indicated time intervals were detected by gel electrophoresis (inset) and analyzed by densitometry scanning of the gels. C: Effects of actinomycin D (Act D) and TNF-α on the expression of the NHE2 mRNA in proliferating cells. C2BBe1 Cells were serum-starved in DMEM containing 0.5% FBS for 24 h and then pre-incubated with Act D (5μg/ml) for 30 min. Subsequently, TNF-α (10 ng/ml) was added and incubation continued for 8 h. Five μg of RNA from each treatment was reverse transcribed to cDNA and equal amounts of cDNA from each sample were subjected to amplification by real-time PCR. D: Whole cell lysates prepared from CeBBe1 cells treated with TNF-α for 6 and 16 h were subjected to Western blot analyses using an antibody specific for NHE2. E: Densitometric analysis of NHE2 protein levels is shown. Data are presented as intensity of the NHE2 protein relative to the actin intensity in the corresponding sample. The activity in the control was set at 100. F: TNF-α decreases the Na+/H+ exchange activity of NHE2 and NHE3. NHE activity was determined in the presence of 50 μM EIPA or 50 μM HOE-694 as described in Materials and Methods. Data are presented as percent of the control that is arbitrarily set to 100. Values are means ± SE of three separate experiments performed in triplicates. P values are indicated.
Figure 2
Figure 2. Functional analysis of the NHE2 promoter in C2BBe1 cells and identification of TNF-α-responsive region
A: NHE2 promoter activity is decreased in response to TNF-α. C2BBe1 cells were transiently transfected with the NHE2 promoter-luciferase constructs p−1051/+150 and p−415/+150 followed by incubation without or with TNF-α for 24 h. Luciferase activity was determined as described in Materials and Methods and is presented relative to the normalized activity of the promoter-less pGL2-basic construct. B: Identification of TNF-α responsive region. A series of the 5′-deletion NHE2 promoter reporter constructs were transiently transfected in C2BBe1 cells, treated with or without TNF-α and processed as described above. Values shown are means ± S.E. from three separate experiments performed in triplicates. Significant differences from the control values are shown (*, P < 0.05).
Figure 3
Figure 3. The effects of TNF-α on the IκB-α, p50 and p65 proteins in C2BBe1 cells
Cytoplasmic and nuclear proteins were prepared from untreated cells or cells treated with TNF-α for indicated time intervals. Twenty μg protein per sample was subjected to 10% SDS-PAGE and transferred onto PVDF membrane. IκB-α in cytoplasmic fraction (Figure A), and p50 and p65 in nuclear fraction (Figure B) were detected using anti-IκB-α, or anti-p50 and anti-65 antibodies, respectively. As a loading control, the blots were re-probed for tubulin or actin using mouse monoclonal antibodies.
Figure 4
Figure 4. TNF-α promotes binding of NF-κB subunits p50 and p65 to the NHE2 promoter region
A: Oligonucleotides used in GMSA. B: Binding of nuclear proteins in TNF-α treated cells to 32P-labeled NHE2-NF-κB probe. Nuclear proteins (5 μg) from untreated (lane 1) or TNF-α treated cells (lanes 2–7) were allowed to interact with the probe in the presence of molar excess of cold competitor oligonucleotides NF-κB consensus sequence, M1, M3, M2 and Sp1 consensus sequence (lanes 3–7, respectively). The unlabeled competitor probes were incubated with the nuclear proteins for 10 minutes prior to addition of radiolabeled NHE2-NFκB probe (50,000 cpm). C: p50 and p65 interact with the NHE2 promoter. NF-κB activation by TNF-α was determined in nuclear proteins from untreated (control) and cells treated with TNF-α for 1. The identities of the proteins present in these complexes were established by supershift assays. Incubation of anti-p50 and anti-p65 antibodies individually (lanes 3 and 4, respectively) or simultaneously (lane 5) resulted in the formation of slow migrating supershifted bands (SS), suggesting the presence of both proteins in the DNA-protein complexes. A 100-molar excess of unlabeled NHE2-NF-κB probe and Sp1 oligonucleotide were used in competition assays (lanes 6 and 7). D: GMSA with NF-κB consensus oligonucleotide used as a positive control. E: ChIP Assay. ChIP assay was performed as described in Materials and Methods. Immunoprecipitated DNA was analyzed by PCR using NHE2 promoter-specific primers. To verify that an equivalent amount of chromatin was used in the immuno-precipitations, an input chromatin was amplified with the same primers as control. C and T, indicate the nuclear proteins from control or TNF-α treated C2BBe1 cells, respectively. NS indicates non-specific binding. M, DNA marker.
Figure 5
Figure 5. NF-κB site is essential for TNF-α-induced repressor effect on hNHE2 promoter
The nucleotide substitutions of the M1 and M2 mutants were introduced into the wild-type NHE2 promoter construct, p−890/+150. Wild-type and mutated constructs were transiently transfected into C2BBe1 cells, and reporter gene activity was measured and analyzed as described in Materials and Methods. The data shown are representative of at least three separate experiments performed in triplicates. *, P < 0.05.
Figure 6
Figure 6. Overexpression of p50 and p65 attenuate NHE2 promoter activity in C2BBe1 cells
A: Proliferating C2BBe1 cells were co-transfected with p50 and p65 expression vectors (0.5 μg) individually or simultaneously along with p−1051/+150 NHE2 promoter reporter construct and treated with TNF-α. Overexpression of p50 and p65 inhibited the NHE2 promoter activity ~ 40% and 60% individually and ~ 65% in combination. B: Effect of TNF-α on NHE2 promoter activity in cells over-expressing p50 and p65. C: p50 and p65 stimulate p-NF-κB-luc reporter activity. C2BBe1 cells were co-transfected with p50 and p65 expression vectors individually or simultaneously along with p-NF-κB-luc construct. D: TNF-α and EGF regulate NHE2 promoter activity via discrete pathways. C2BBe1 cells were stably transfected with NHE2 promoter construct, p−890/+150 and then allowed to grown for 12 days before serum starvation and treatment with TNF-α (20 ng/ml), EGF (100 ng/ml) or both. Luciferase activities were determined after 24 h and analyzed in comparison to untreated cells. The data shown are representative of at least three separate experiments performed in triplicates. *, P < 0.05; **, P < 0.001.
Figure 7
Figure 7. TNF-α-induced repression of NHE2 promoter is mediated via NF-κB signaling pathway
C2BBe1 cells were transiently transfected with the p−1051/+150 NHE2 promoter reporter constructs and serum-starved in DMEM containing 0.5% FBS overnight. Cells were incubated with CAPE (25 μM) (A), and LC (5 μM) (B) for 1 h prior to addition of TNF-α then TNF-α was added and incubation continued for 24 h. 48 h post-transfection, cells were harvested and luciferase and β-galactosidase activities were determined. Data shown are mean± S.E. of least three separate experiments performed in triplicates. *, P <0.05.

References

    1. Zachos NC, Tse M, Donowitz M. Molecular physiology of intestinal Na+/H+ exchange. Annu Rev Physiol. 2005;67:411–43. - PubMed
    1. Kiela PR, Ghishan FK. Ion transport in the intestine. Curr Opin Gastroenterol. 2009;25:87–91. - PMC - PubMed
    1. Malakooti J, Dahdal RY, Dudeja PK, et al. The human Na(+)/H(+) exchanger NHE2 gene: genomic organization and promoter characterization. Am J Physiol Gastrointest Liver Physiol. 2001;280:G763–73. - PubMed
    1. Pearse I, Zhu YX, Murray EJ, et al. Sp1 and Sp3 control constitutive expression of the human NHE2 promoter by interactions with the proximal promoter and the transcription initiation site. Biochem J. 2007;407:101–11. - PMC - PubMed
    1. Malakooti J, Sandoval R, Memark VC, et al. Zinc finger transcription factor Egr-1 is involved in stimulation of NHE2 gene expression by phorbol 12-myristate 13-acetate. Am J Physiol Gastrointest Liver Physiol. 2005;289:G653–63. - PubMed

Publication types

MeSH terms