Comparative Study
. 2010 Sep 21;49(37):8187-96.
doi: 10.1021/bi100802k.

Direct measurement of mercury(II) removal from organomercurial lyase (MerB) by tryptophan fluorescence: NmerA domain of coevolved γ-proteobacterial mercuric ion reductase (MerA) is more efficient than MerA catalytic core or glutathione

Affiliations
Comparative Study

Direct measurement of mercury(II) removal from organomercurial lyase (MerB) by tryptophan fluorescence: NmerA domain of coevolved γ-proteobacterial mercuric ion reductase (MerA) is more efficient than MerA catalytic core or glutathione

Baoyu Hong et al. Biochemistry. .

Abstract

Aerobic and facultative bacteria and archaea harboring mer loci exhibit resistance to the toxic effects of Hg(II) and organomercurials [RHg(I)]. In broad spectrum resistance, RHg(I) is converted to less toxic Hg(0) in the cytosol by the sequential action of organomercurial lyase (MerB: RHg(I) → RH + Hg(II)) and mercuric ion reductase (MerA: Hg(II) → Hg(0)) enzymes, requiring transfer of Hg(II) from MerB to MerA. Although previous studies with γ-proteobacterial versions of MerA and a nonphysiological Hg(II)-DTT-MerB complex qualitatively support a pathway for direct transfer between proteins, assessment of the relative efficiencies of Hg(II) transfer to the two different dicysteine motifs in γ-proteobacterial MerA and to competing cellular thiol is lacking. Here we show the intrinsic tryptophan fluorescence of γ-proteobacterial MerB is sensitive to Hg(II) binding and use this to probe the kinetics of Hg(II) removal from MerB by the N-terminal domain (NmerA) and catalytic core C-terminal cysteine pairs of its coevolved MerA and by glutathione (GSH), the major competing cellular thiol in γ-proteobacteria. At physiologically relevant concentrations, reaction with a 10-fold excess of NmerA over HgMerB removes ≥92% Hg(II), while similar extents of reaction require more than 1000-fold excess of GSH. Kinetically, the apparent second-order rate constant for Hg(II) transfer from MerB to NmerA, at (2.3 ± 0.1) × 10(4) M(-1) s(-1), is ∼100-fold greater than that for GSH ((1.2 ± 0.2) × 10(2) M(-1) s(-1)) or the MerA catalytic core (1.2 × 10(2) M(-1) s(-1)), establishing transfer to the metallochaperone-like NmerA domain as the kinetically favored pathway in this coevolved system.


Figures

Figure 1
Figure 1
Most significant amino acid differences between Tn501 and pDU1358 MerA occur on surfaces. Clustal W2 (version 2.0.11; http://www.ebi.ac.uk/Tools/es/cgi-bin/clustalw2/) alignment of MerA sequences from well characterized narrow spectrum Tn501 operon (GenBank accession no. Z00027; MerA core PDB ID: 1ZK7; NmerA PDB ID: 2KT2) and broad spectrum pDU1358 operon (GenBank accession no. GU062788). NmerA domain (residues 1–69) and catalytic core (residues 96–561) (13) sequences are in black with surface variations highlighted; linker region (residues 70–95) sequence is pale gray. Black highlights/yellow letters: surface residues most likely to interact with MerB; gray highlights/white letters: other surface residues more remote from potential interacting di-cysteine motifs; light gray highlights/red letters: Hg(II)-binding (Cys11, Cys14, Cys558, Cys559) and catalytic (Cys136, Cys141) cysteines.
Figure 2
Figure 2
MerB tryptophan fluorescence is sensitive to Hg(II) binding. (A) Overall structure of HgMerB and (B) close-up of active site (PDB ID: 3FN8 (32)) showing the position of Trp95 relative to Hg(II) bound to Cys96 & Cys159 at the catalytic site, and Cys160 that may be involved in Hg(II) transfer. Electron density for Cys160 indicates it adopts two conformations in the crystal structures (24, 32). (C) Changes in MerB intrinsic tryptophan fluorescence upon binding/release of Hg(II) at 25 °C. Normalized spectra obtained with γex = 295 nm are for MerB (5 µM) (spectrum A), MerB + 1.0 equiv HgBr2 (spectrum B), HgMerB after addition of 350 µM NmerA (spectrum C). Inset - changes in fluorescence emission at 340 nm with γex = 280 nm. Off-peak excitation at 295 nm was used for spectra comparing effect of NmerA to avoid inner filter effects of absorbance by NmerA at 280 nm.
Figure 3
Figure 3
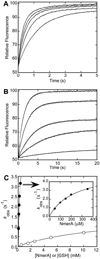
Stopped flow kinetic analysis of Hg(II) transfer from HgMerB to the NmerA domain of MerA, glutathione, and the MerA catalytic core. (A) Kinetic traces (from lower to higher) for reaction of 5 µM HgMerB with NmerA at 50, 100, 150, 200 and 350 µM, final concentrations. (B) Kinetic traces (from lower to higher) for reaction of 5 µM HgMerB with GSH at 0.5, 1.5, 2.5, 5 and 10 mM, final concentrations. Data in panels A and B are shown in dark gray, fits to eq 1 as described in the text are in black. (C) Observed first order rate constants, kobs, for the fast phases for Hg(II) removal from HgMerB as a function of NmerA or GSH concentration. Data for NmerA (●) and GSH (○) are compared in the main plot and the NmerA data are expanded in the inset. The error bars are smaller than the symbols. Solid lines are the fits of the data to eq 2 in Kaleidagraph.
Figure 4
Figure 4
Berkeley Madonna™ global fits to kinetic traces for reactions of NmerA and GSH with HgMerB. (A) Fits for NmerA reactions using model in Scheme 2. Final rate constants are summarized in Table 2. (B) Fits for GSH reactions using full model in Scheme 3. Final rate constants are summarized in Table 3. (C) Fits for GSH reactions using model in Scheme 3 with k17, k18, k19, k20 = 0 to eliminate reversion path. Data in all panels are in black and fits are in dark gray.
Figure 5
Figure 5
Stopped flow kinetic analysis of Hg(II) transfer from HgMerB to the MerA catalytic core. Kinetic traces (from lower to higher) are for reaction of 5 µM MerA catalytic core with 50, 100, 150, 200, 350, and 500 µM HgMerB, final concentrations. Data are shown in dark gray, fits to eq 1 (i=1) are in black. Inset: Observed first order rate constants, kobs, as a function of HgMerB concentration.
Scheme 1
Scheme 1
Minimal mechanism consistent with concentration dependence of kobs for NmerA and GSH
Scheme 2
Scheme 2
Proposed model for reaction of NmerA with HgMerB.
Scheme 3
Scheme 3
Proposed model for reaction of GSH with HgMerB

References

    1. Morel FMM, Kraepiel AML, Amyot M. The chemical cycle and bioaccumulation of mercury. Annu. Rev. Ecol. Syst. 1998;29:543–566.
    1. Clarkson TW, Magos L. The toxicology of mercury and its chemical compounds. Crit. Rev. Toxicol. 2006;36:609–662. - PubMed
    1. Casas JS, Jones MM. Mercury(II) complexes with sulfhydryl containing chelating agents: stability constant inconsistencies and their resolution. J. Inorg. Nucl. Chem. 1980;42:99–102.
    1. Cheesman BV, Arnold AP, Rabenstein DL. Nuclear magnetic resonance studies of the solution chemistry of metal complexes. 25. Hg(thiol)3 complexes and Hg(II)-thiol ligand exchange kinetics. J. Am. Chem. Soc. 1988;110:6359–6364.
    1. Zalups RK, Ahmad S. Handling of cysteine S-conjugates of methylmercury in MDCK cells expressing human OAT1. Kidney Int. 2005;68:1684–1699. - PubMed

Publication types

Associated data