Vascular recovery promoted by atorvastatin and simvastatin after experimental intracerebral hemorrhage: magnetic resonance imaging and histological study
- PMID: 20722611
- PMCID: PMC3150838
- DOI: 10.3171/2010.7.JNS10163
Vascular recovery promoted by atorvastatin and simvastatin after experimental intracerebral hemorrhage: magnetic resonance imaging and histological study
Abstract
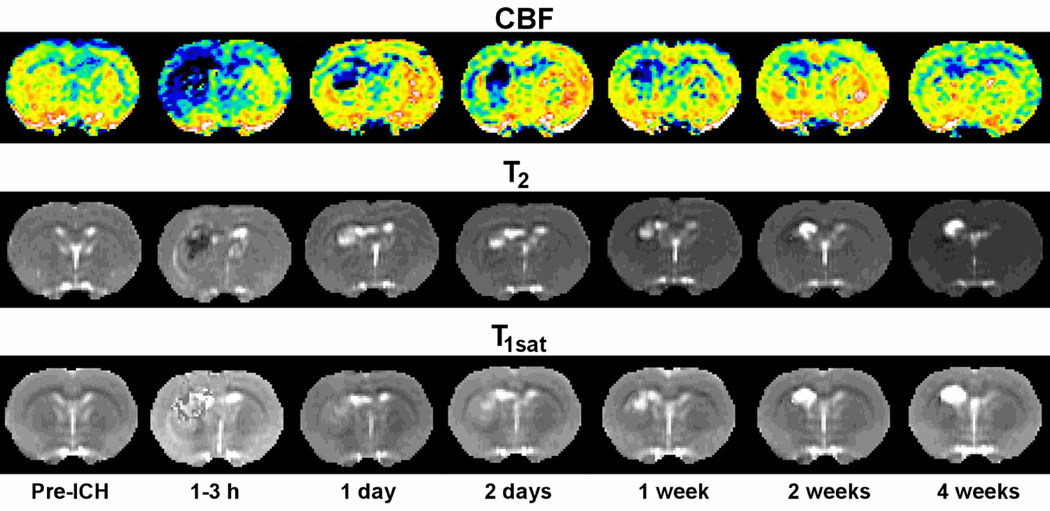
Object: Longitudinal multiparametric MR imaging and histological studies were performed on simvastatin- or atorvastatin-treated rats to evaluate vascular repair mechanisms after experimental intracerebral hemorrhage (ICH).
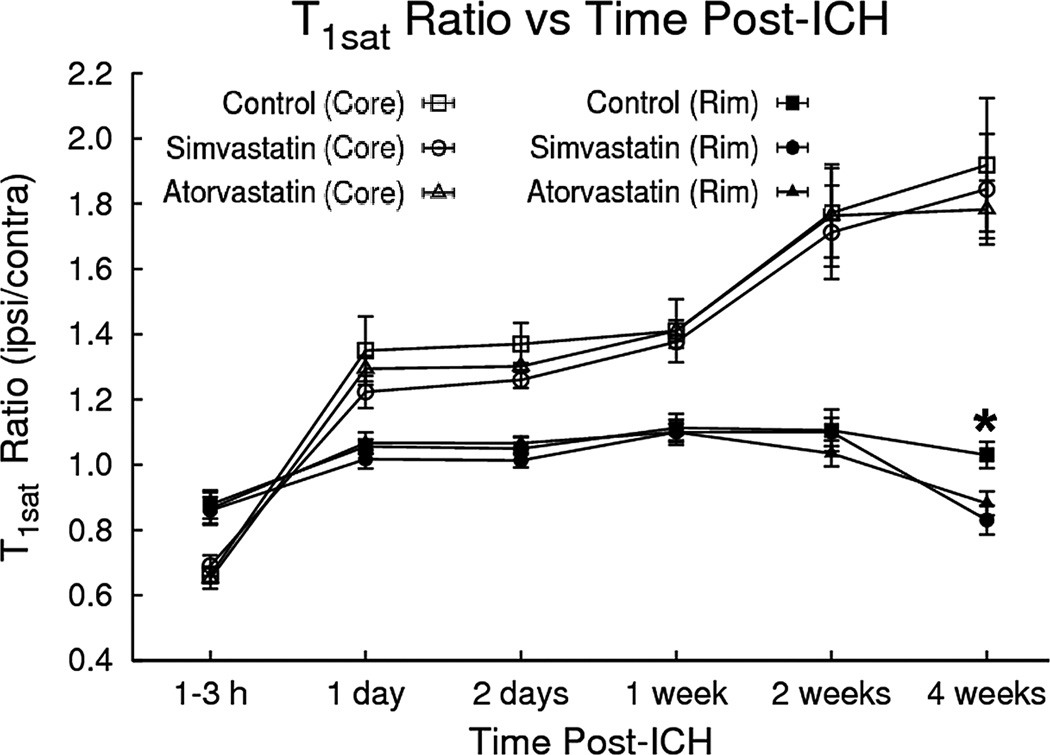
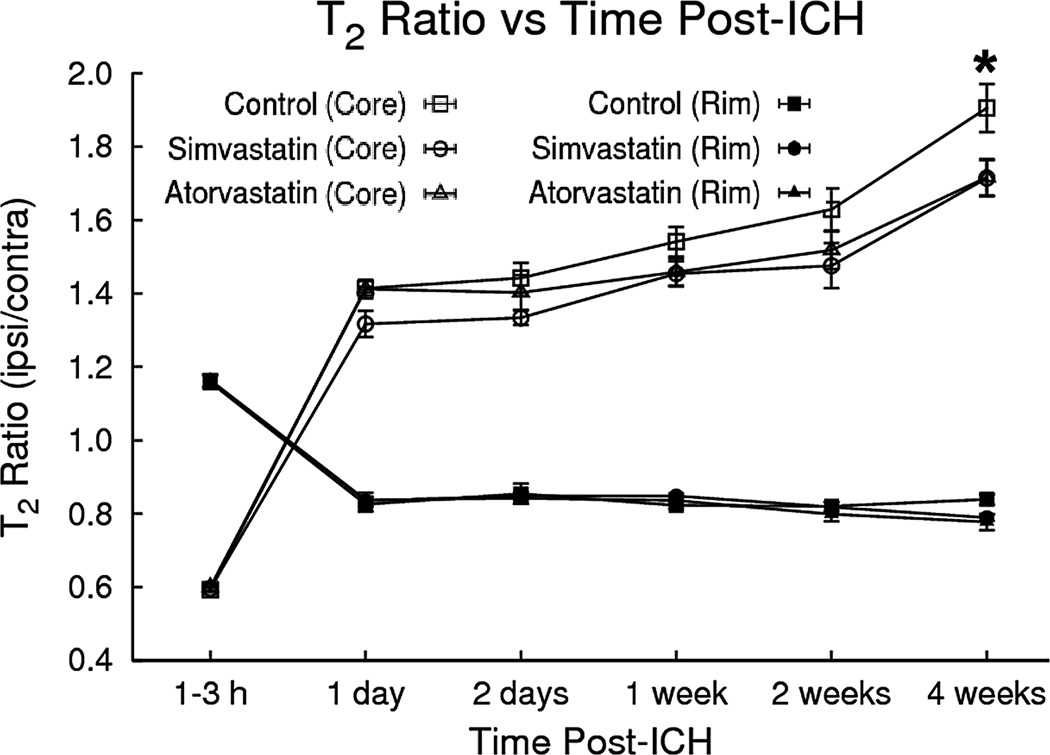
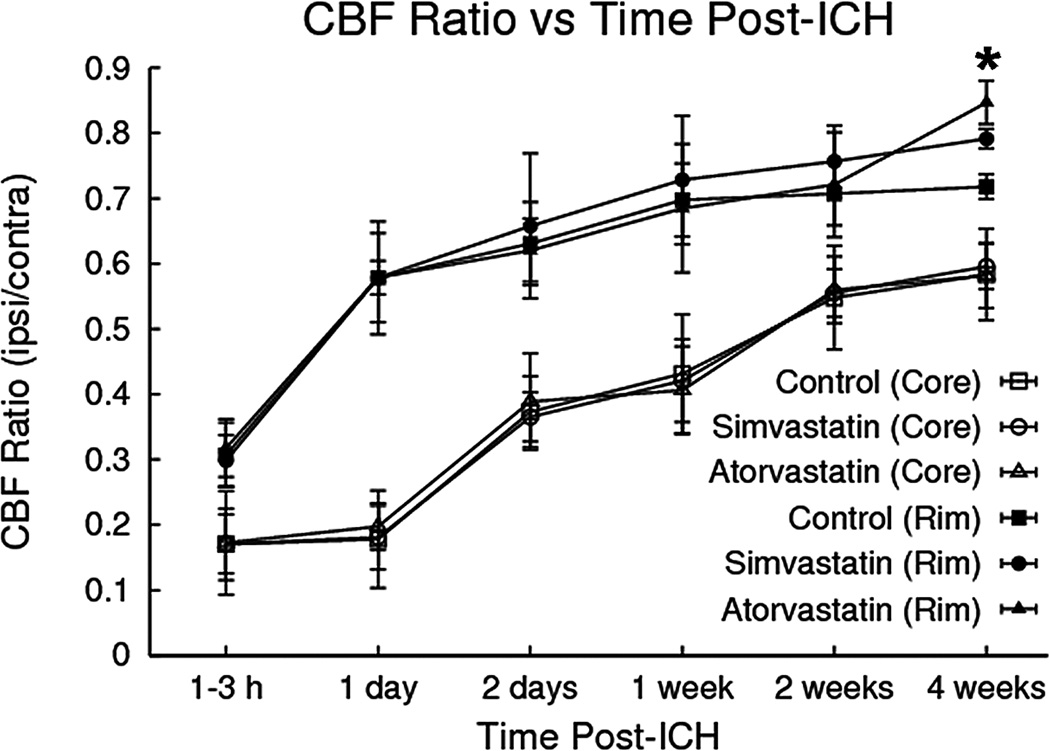
Methods: Primary ICH was induced in adult Wistar rats by direct infusion of 100 μl of autologous blood into the striatal region adjacent to the subventricular zone. Atorvastatin (2 mg/kg), simvastatin (2 mg/kg), or phosphate-buffered saline was given orally at 24 hours post-ICH and continued daily for 7 days. The temporal evolution of ICH in each group was assessed by MR imaging measurements of T2, T1(sat), and cerebral blood flow in brain areas corresponding to the bulk of the hemorrhage (core) and edematous border (rim). Rats were killed after the final MR imaging examination at 28 days, and histological studies were performed. A small group of sham-operated animals was also studied. Neurobehavioral testing was performed in all animals. Analysis of variance methods were used to compare results from the treatment and control groups, with significance inferred at p ≤ 0.05.
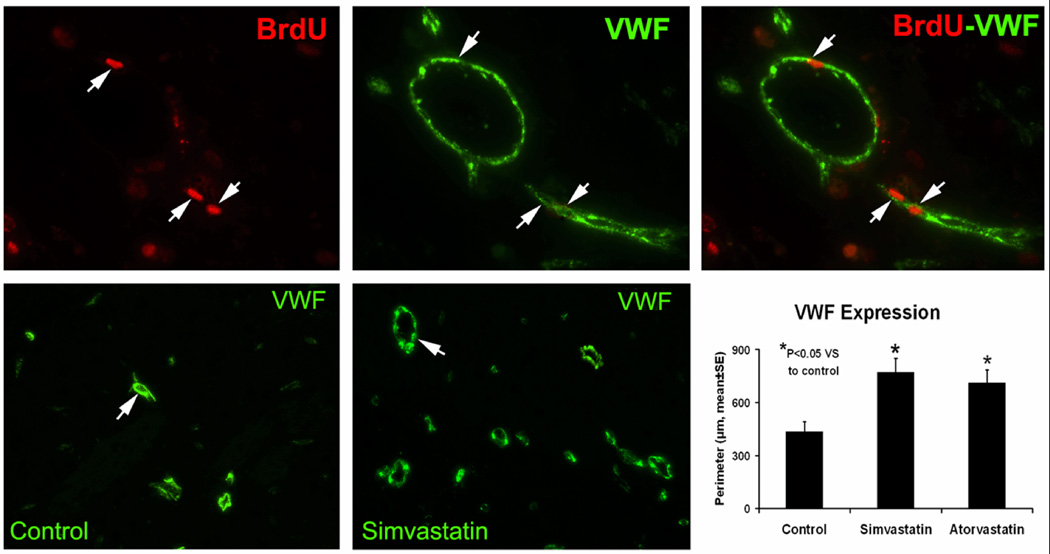
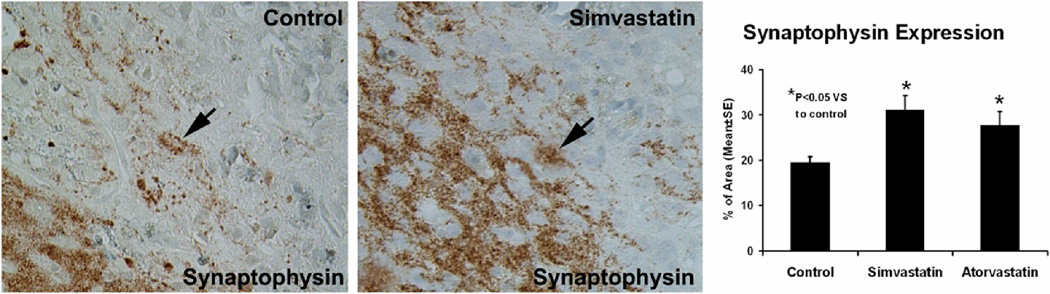
Results: Using histological indices, animals treated with simvastatin and atorvastatin had significantly increased angiogenesis and synaptogenesis in the hematoma rim compared with the control group (p ≤ 0.05). The statin-treated animals exhibited significantly increased cerebral blood flow in the hematoma rim at 4 weeks, while blood-brain barrier permeability (T1(sat)) and edema (T2) in the corresponding regions were reduced. Both statin-treated groups showed significant neurological improvement from 2 weeks post-ICH onward.
Conclusions: The results of the present study demonstrate that simvastatin and atorvastatin significantly improve the recovery of rats from ICH, possibly via angiogenesis and synaptic plasticity. In addition, in vivo multiparametric MR imaging measurements over time can be effectively applied to the experimental ICH model for longitudinal assessment of the therapeutic intervention.
Conflict of interest statement
The authors report no conflict of interest concerning the materials or methods used in this study or the findings specified in this paper.
Figures
References
-
- Ariesen MJ, Claus SP, Rinkel GJ, Algra A. Risk factors for intracerebral hemorrhage in the general population: a systematic review. Stroke. 2003;34:2060–2065. - PubMed
-
- Brix G, Schad LR, Deimling M, Lorenz WJ. Fast and precise T1 imaging using a TOMROP sequence. Magn Reson Imaging. 1990;8:351–356. - PubMed
-
- Chen J, Zhang ZG, Li Y, Wang Y, Wang L, Jiang H, et al. Statins induce angiogenesis, neurogenesis, and synaptogenesis after stroke. Ann Neurol. 2003;53:743–751. - PubMed
-
- Chopp M, Zhang ZG, Jiang Q. Neurogenesis, angiogenesis, and MRI indices of functional recovery from stroke. Stroke. 2007;38:827–831. - PubMed
-
- Detre JA, Leigh JS, Williams DS, Koretsky AP. Perfusion imaging. Magn Reson Med. 1992;23:37–45. - PubMed
Publication types
MeSH terms
Substances
Grants and funding
LinkOut - more resources
Full Text Sources
Medical
Research Materials