. 2011 Mar;12(3):145-56.
doi: 10.1111/j.1468-1293.2010.00863.x. Epub 2010 Aug 15.

The HIV protease inhibitor lopinavir/ritonavir (Kaletra) alters the growth, differentiation and proliferation of primary gingival epithelium

Affiliations

The HIV protease inhibitor lopinavir/ritonavir (Kaletra) alters the growth, differentiation and proliferation of primary gingival epithelium

M Israr et al. HIV Med. 2011 Mar.

Abstract

Objective: This study was designed to evaluate the effects of the HIV protease inhibitor lopinavir/ritonavir on gingival epithelium growth, integrity and differentiation.

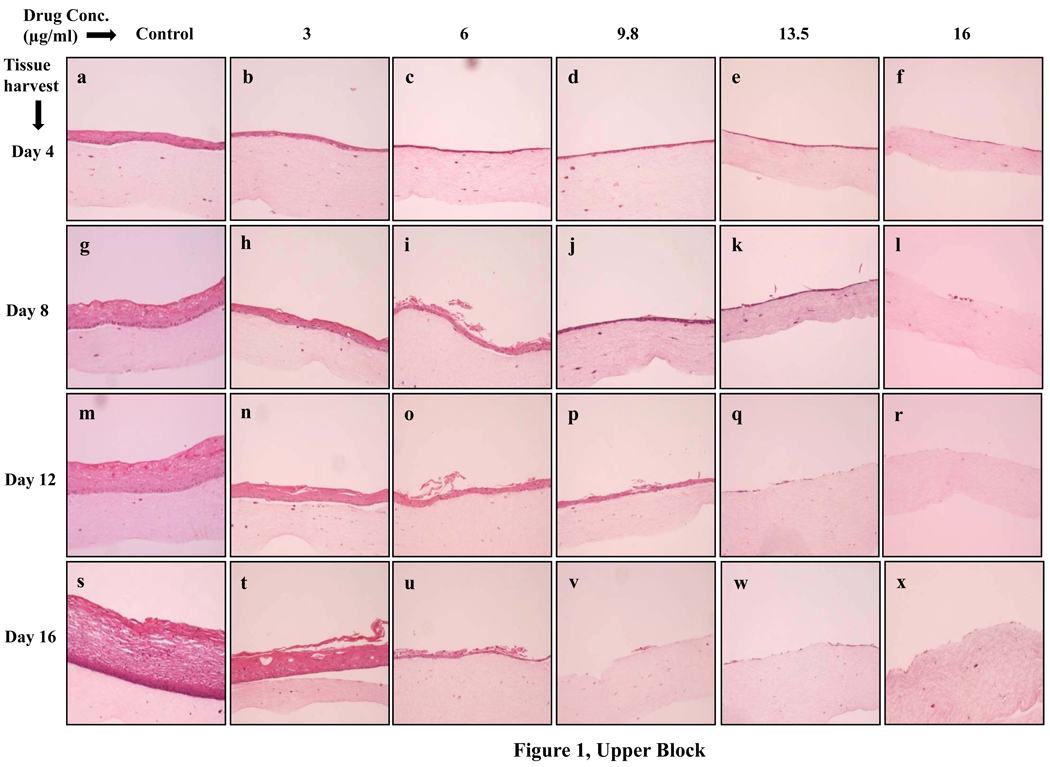
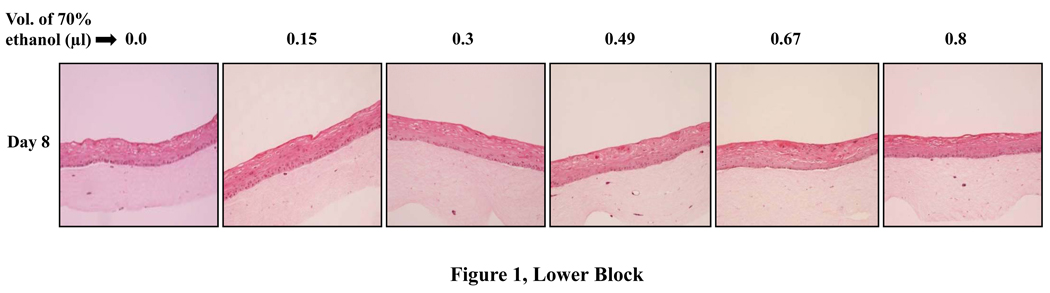
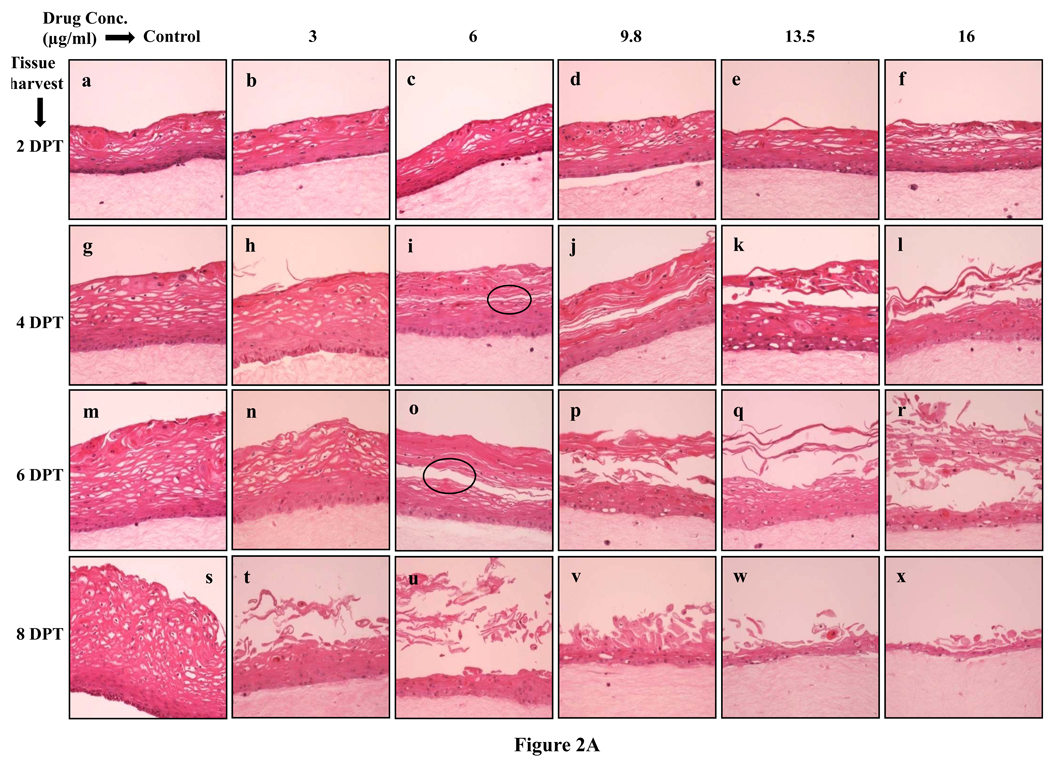
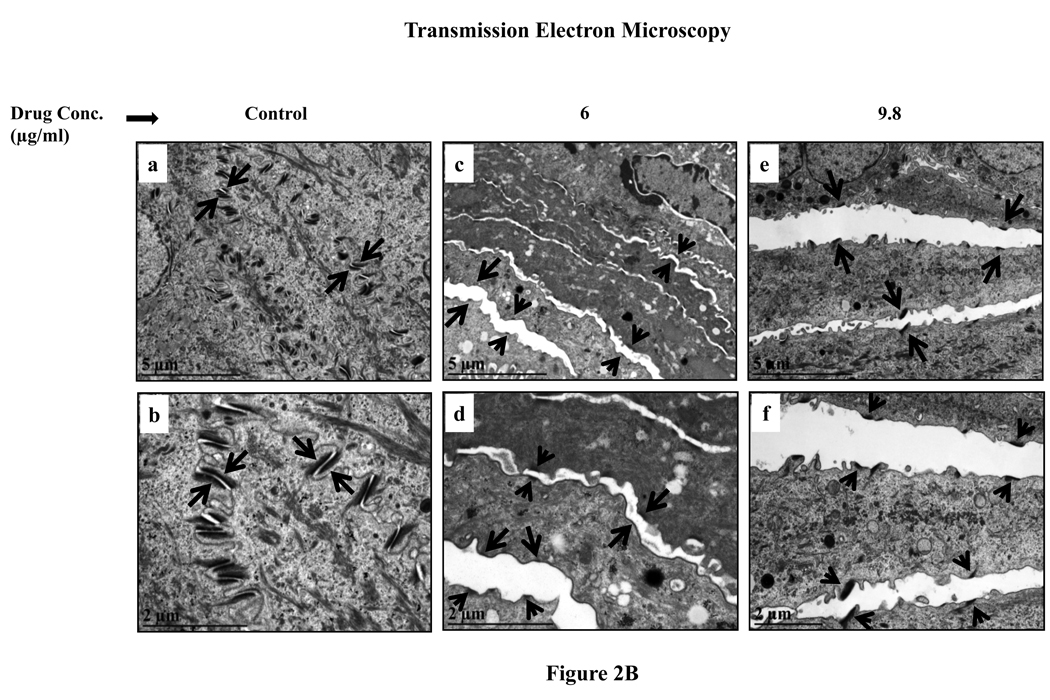
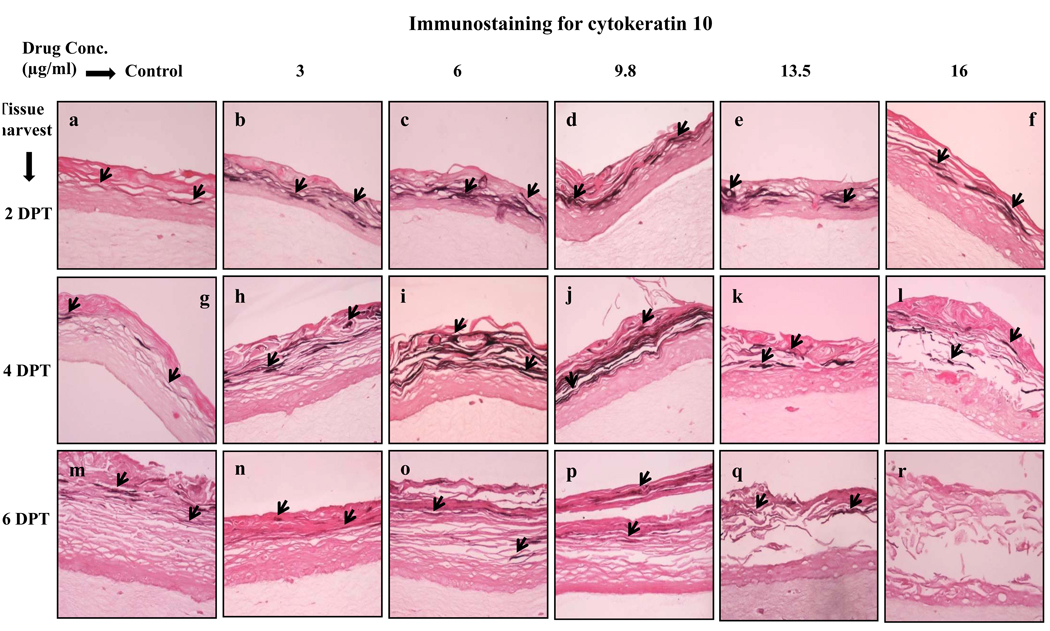
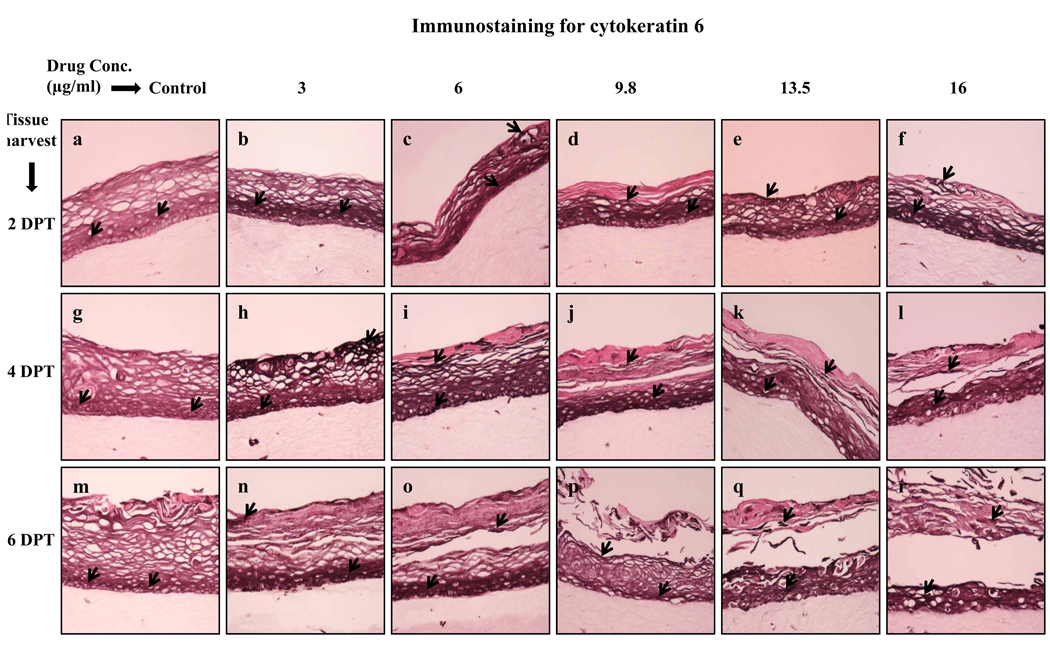
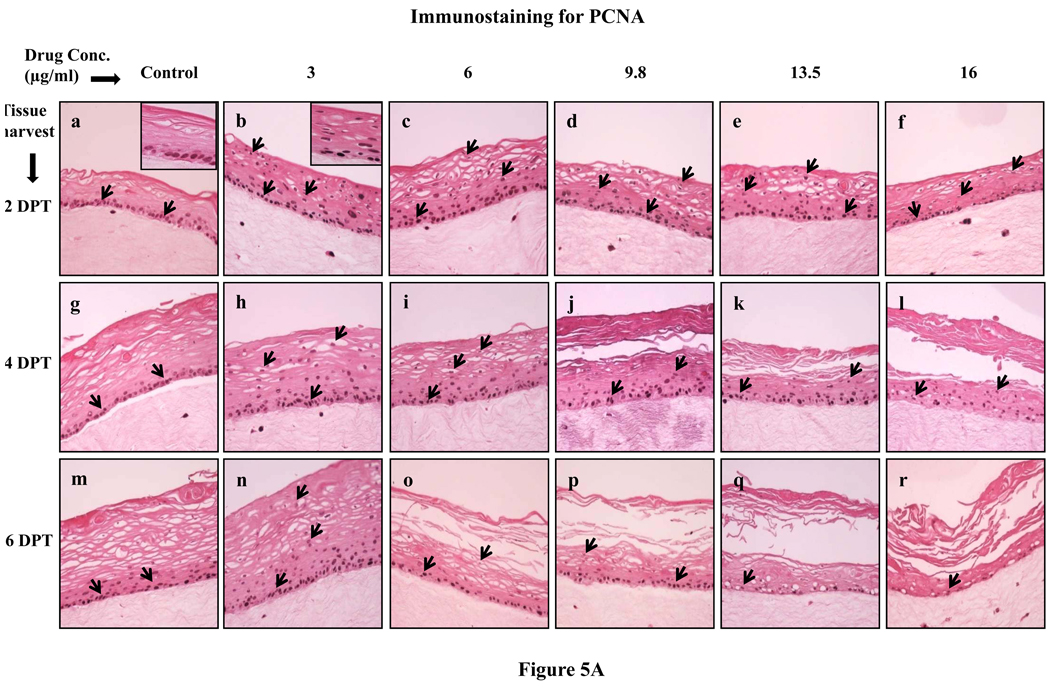
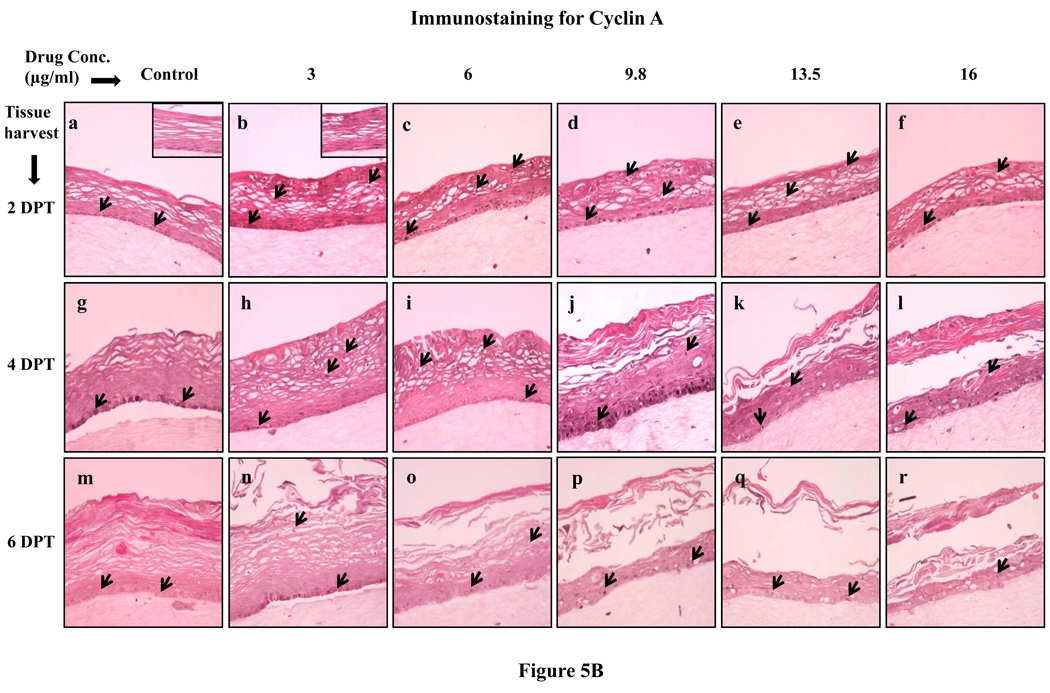
Methods: Organotypic (raft) cultures of gingival keratinocytes were established and treated with a range of lopinavir/ritonavir concentrations. To examine the effect of lopinavir/ritonavir on gingival epithelium growth and stratification, haematoxylin and eosin staining was performed. To investigate the effect of this drug on tissue integrity, transmission electron microscopy (TEM) was performed on untreated and drug-treated tissues. Further, immunohistochemical analysis of raft cultures was performed to assess the effect of lopinavir/ritonavir on the expression of key differentiation and proliferation markers including cytokeratins, proliferating cell nuclear antigen (PCNA) and cyclin A.

Results: Lopinavir/ritonavir treatments drastically inhibited the growth of gingival epithelium when the drug was present throughout the growth period of the tissue. When the drug was added on day 8 of tissue growth, lopinavir/ritonavir treatments compromised tissue integrity over time and altered the proliferation and differentiation of gingival keratinocytes. Expression of cytokeratins 5, 14, 10 and 6, PCNA and cyclin A was induced, and their expression patterns were also altered over time in treated rafts.

Conclusions: The findings of our studies suggest that lopinavir/ritonavir treatments compromised tissue integrity over time and deregulated the cell cycle/proliferation and differentiation pathways, resulting in abnormal epithelial repair and proliferation. Our study provides a model of potential utility in studying the effects of antiretroviral drugs in vitro.


Figures

Fig. 1
Fig. 1
Upper Block. Effect of lopinavir/ritonavir on gingival epithelium growth and stratification. Primary gingival keratinocytes were grown in organotypic (raft) cultures and treated with different concentrations of lopinavir/ritonavir throughout the growth period. (Panels a, g, m, and s) untreated rafts; (Panels b, h, n and t) rafts treated with 3 µg/ml lopinavir/ritonavir; (Panels c, i, o and u) rafts treated with 6 µg/ml lopinavir/ritonavir; (Panels d, j, p and v) rafts treated with 9.8 µg/ml lopinavir/ritonavir; (Panels e, k, q and w) rafts treated with 13.5 µg/ml lopinavir/ritonavir; (Panels f, l, r and x) rafts treated with 16 µg/ml lopinavir/ritonavir. Rafts were harvested at different points and stained with hematoxylin and eosin. (Panels a to f) rafts were harvested at day 4; (Panels g to l) rafts were harvested at day 8; (Panels m to r) rafts were harvested at day 12; (Panels s to x) rafts were harvested at day 16. Images are at 10 × original magnification. Lower Block. Effect of 70% ethanol corresponding to the different drug treatments on gingival epithelium growth and stratification. Treatment with 3, 6, 9.8, 13.5 and 16 µg/ml lopinavir/ritonavir corresponds to exposure of raft cultures with 0.15, 0.3, 0.49, 0.69 and 0.8 µl of 70% ethanol per ml of E-media respectively.
Fig. 1
Fig. 1
Upper Block. Effect of lopinavir/ritonavir on gingival epithelium growth and stratification. Primary gingival keratinocytes were grown in organotypic (raft) cultures and treated with different concentrations of lopinavir/ritonavir throughout the growth period. (Panels a, g, m, and s) untreated rafts; (Panels b, h, n and t) rafts treated with 3 µg/ml lopinavir/ritonavir; (Panels c, i, o and u) rafts treated with 6 µg/ml lopinavir/ritonavir; (Panels d, j, p and v) rafts treated with 9.8 µg/ml lopinavir/ritonavir; (Panels e, k, q and w) rafts treated with 13.5 µg/ml lopinavir/ritonavir; (Panels f, l, r and x) rafts treated with 16 µg/ml lopinavir/ritonavir. Rafts were harvested at different points and stained with hematoxylin and eosin. (Panels a to f) rafts were harvested at day 4; (Panels g to l) rafts were harvested at day 8; (Panels m to r) rafts were harvested at day 12; (Panels s to x) rafts were harvested at day 16. Images are at 10 × original magnification. Lower Block. Effect of 70% ethanol corresponding to the different drug treatments on gingival epithelium growth and stratification. Treatment with 3, 6, 9.8, 13.5 and 16 µg/ml lopinavir/ritonavir corresponds to exposure of raft cultures with 0.15, 0.3, 0.49, 0.69 and 0.8 µl of 70% ethanol per ml of E-media respectively.
Fig. 2
Fig. 2
A. Effect of lopinavir/ritonavir on gingival epithelium morphology and stratification. Primary gingival keratinocytes were grown in organotypic (raft) cultures and treated with different concentrations of lopinavir/ritonavir at day 8. (Panels a, g, m, and s) untreated rafts; (Panels b, h, n and t) rafts treated with 3 µg/ml lopinavir/ritonavir; (Panels c, i, o and u) rafts treated with 6 µg/ml lopinavir/ritonavir; (Panels d, j, p and v) rafts treated with 9.8 µg/ml lopinavir/ritonavir; (Panels e, k, q and w) rafts treated with 13.5 µg/ml lopinavir/ritonavir; (Panels f, l, r and x) rafts treated with 16 µg/ml lopinavir/ritonavir. Rafts were harvested at different points and stained with hematoxylin and eosin. (Panels a to f) rafts were harvested at 2 days post treatment; (Panels g to l) rafts were harvested at 4 days post treatment; (Panels m to r) rafts were harvested at 6 days post treatment; (Panels s to x) rafts were harvested at 8 days post treatment. Images are at 20 × original magnification. Circles in images i and o indicate less tight cell-cell contacts within the stratified layers or tissues with compromised integrity. B. Transmission electron microscopy micrographs of untreated and lopinavir/ritonavir treated gingival tissue. (Panels a and b) untreated rafts; (Panels c and d) rafts treated with 6 µg/ml lopinavir/ritonavir; (Panels e and f) rafts treated with 9.8 µg/ml lopinavir/ritonavir. (Panels a, c and e) micrograph at low magnification; (Panels b, d and f) micrograph at higher magnification. Arrows indicate the desmosomes configuration.
Fig. 2
Fig. 2
A. Effect of lopinavir/ritonavir on gingival epithelium morphology and stratification. Primary gingival keratinocytes were grown in organotypic (raft) cultures and treated with different concentrations of lopinavir/ritonavir at day 8. (Panels a, g, m, and s) untreated rafts; (Panels b, h, n and t) rafts treated with 3 µg/ml lopinavir/ritonavir; (Panels c, i, o and u) rafts treated with 6 µg/ml lopinavir/ritonavir; (Panels d, j, p and v) rafts treated with 9.8 µg/ml lopinavir/ritonavir; (Panels e, k, q and w) rafts treated with 13.5 µg/ml lopinavir/ritonavir; (Panels f, l, r and x) rafts treated with 16 µg/ml lopinavir/ritonavir. Rafts were harvested at different points and stained with hematoxylin and eosin. (Panels a to f) rafts were harvested at 2 days post treatment; (Panels g to l) rafts were harvested at 4 days post treatment; (Panels m to r) rafts were harvested at 6 days post treatment; (Panels s to x) rafts were harvested at 8 days post treatment. Images are at 20 × original magnification. Circles in images i and o indicate less tight cell-cell contacts within the stratified layers or tissues with compromised integrity. B. Transmission electron microscopy micrographs of untreated and lopinavir/ritonavir treated gingival tissue. (Panels a and b) untreated rafts; (Panels c and d) rafts treated with 6 µg/ml lopinavir/ritonavir; (Panels e and f) rafts treated with 9.8 µg/ml lopinavir/ritonavir. (Panels a, c and e) micrograph at low magnification; (Panels b, d and f) micrograph at higher magnification. Arrows indicate the desmosomes configuration.
Fig. 3
Fig. 3
Expression pattern of cytokeratin 10 in untreated and lopinavir/ritonavir treated gingival raft cultures. Primary gingival keratinocytes were grown in organotypic (raft) cultures and treated with different concentrations of lopinavir/ritonavir at day 8. (Panels a, g and m) untreated rafts; (Panels b, h and n) rafts treated with 3 µg/ml lopinavir/ritonavir; (Panels c, i and o) rafts treated with 6 µg/ml lopinavir/ritonavir; (Panels d, j and p) rafts treated with 9.8 µg/ml lopinavir/ritonavir; (Panels e, k and q) rafts treated with 13.5 µg/ml lopinavir/ritonavir; (Panels f, l and r) rafts treated with 16 µg/ml lopinavir/ritonavir. Rafts were harvested at different points and stained with anti-cytokeratin 10 antibody. (Panels a to f) rafts were harvested at 2 days post treatment; (Panels g to l) rafts were harvested at 4 days post treatment; (Panels m to r) rafts were harvested at 6 days post treatment. Arrows indicate the expression of cytokeratin 10. Images are at 20 × original magnification.
Fig. 4
Fig. 4
Expression pattern of cytokeratin 6 in untreated and lopinavir/ritonavir treated gingival raft cultures. Primary gingival keratinocytes were grown in organotypic (raft) cultures and treated with different concentrations of lopinavir/ritonavir at day 8. (Panels a, g and m) untreated rafts; (Panels b, h and n) rafts treated with 3 µg/ml lopinavir/ritonavir; (Panels c, i and o) rafts treated with 6 µg/ml lopinavir/ritonavir; (Panels d, j and p) rafts treated with 9.8 µg/ml lopinavir/ritonavir; (Panels e, k and q) rafts treated with 13.5 µg/ml lopinavir/ritonavir; (Panels f, l and r) rafts treated with 16 µg/ml lopinavir/ritonavir. Rafts were harvested at different points and stained with anti-cytokeratin 6 antibody. (Panels a to f) rafts were harvested at 2 days post treatment; (Panels g to l) rafts were harvested at 4 days post treatment; (Panels m to r) rafts were harvested at 6 days post treatment. Arrows indicate the expression of cytokeratin 6. Images are at 20 × original magnification..
Fig. 5
Fig. 5
(A) Proliferating cell nuclear antigen and (B) cyclin A expression pattern in untreated and lopinavir/ritonavir treated gingival raft cultures. Primary gingival keratinocytes were grown in organotypic (raft) cultures and treated with different concentrations of lopinavir/ritonavir at day 8. (Panels a, g and m) untreated rafts; (Panels b, h and n) rafts treated with 3 µg/ml lopinavir/ritonavir; (Panels c, i and o) rafts treated with 6 µg/ml lopinavir/ritonavir; (Panels d, j and p) rafts treated with 9.8 µg/ml lopinavir/ritonavir; (Panels e, k and q) rafts treated with 13.5 µg/ml lopinavir/ritonavir; (Panels f, l and r) rafts treated with 16 µg/ml lopinavir/ritonavir. Rafts were harvested at different points and stained with anti-PCNA and cyclin A antibody. (Panels a to f) rafts were harvested at 2 days post treatment; (Panels g to l) rafts were harvested at 4 days post treatment; (Panels m to r) rafts were harvested at 6 days post treatment. Arrows indicate the expression of PCNA and cyclin A. Images are at 20 × original magnification.
Fig. 5
Fig. 5
(A) Proliferating cell nuclear antigen and (B) cyclin A expression pattern in untreated and lopinavir/ritonavir treated gingival raft cultures. Primary gingival keratinocytes were grown in organotypic (raft) cultures and treated with different concentrations of lopinavir/ritonavir at day 8. (Panels a, g and m) untreated rafts; (Panels b, h and n) rafts treated with 3 µg/ml lopinavir/ritonavir; (Panels c, i and o) rafts treated with 6 µg/ml lopinavir/ritonavir; (Panels d, j and p) rafts treated with 9.8 µg/ml lopinavir/ritonavir; (Panels e, k and q) rafts treated with 13.5 µg/ml lopinavir/ritonavir; (Panels f, l and r) rafts treated with 16 µg/ml lopinavir/ritonavir. Rafts were harvested at different points and stained with anti-PCNA and cyclin A antibody. (Panels a to f) rafts were harvested at 2 days post treatment; (Panels g to l) rafts were harvested at 4 days post treatment; (Panels m to r) rafts were harvested at 6 days post treatment. Arrows indicate the expression of PCNA and cyclin A. Images are at 20 × original magnification.

Similar articles

Cited by

References

    1. Global summary of the AIDS epidemic. The Joint United Nations Programme on HIV AIDS (UNAIDS) 2009. Nov [accessed 22 February 2010]. Available at http://data.unaids.org/pub/Report/2009/JC1700_Epi_Update_2009_en.pdf. - PubMed
    1. Gortmaker SL, Hughes M, Cervia J, et al. Effects of combination therapy including protease inhibitors on mortality among children and adolescents infected with HIV-1. N Engl J Med. 2001;345:1522–1528. - PubMed
    1. Granados JMS, Amador JTR, De Miguel SF, et al. Impact of highly active antiretroviral therapy on the morbidity and mortality in Spanish human immunodeficiency virus infected children. Pediatr Infect Dis J. 2003;22:863–867. - PubMed
    1. Patton LL, McKaig R, Strauses R, Rogers D, Eron JJ., Jr Changing prevalence of oral manifestations of human immunodeficiency virus in the era of protease inhibitor therapy. Oral Surg Oral Med Oral Pathol Oral Radiol Endod. 2000;89:299–304. - PubMed
    1. Greenspan D, Canchola AJ, MacPhail A, Cheikh B, Greenspan JS. Effect of highly active antiretroviral therapy on frequency of oral warts. Lancet. 2001;357:1411–1412. - PubMed

Publication types